2 July 2025
1300 794 893


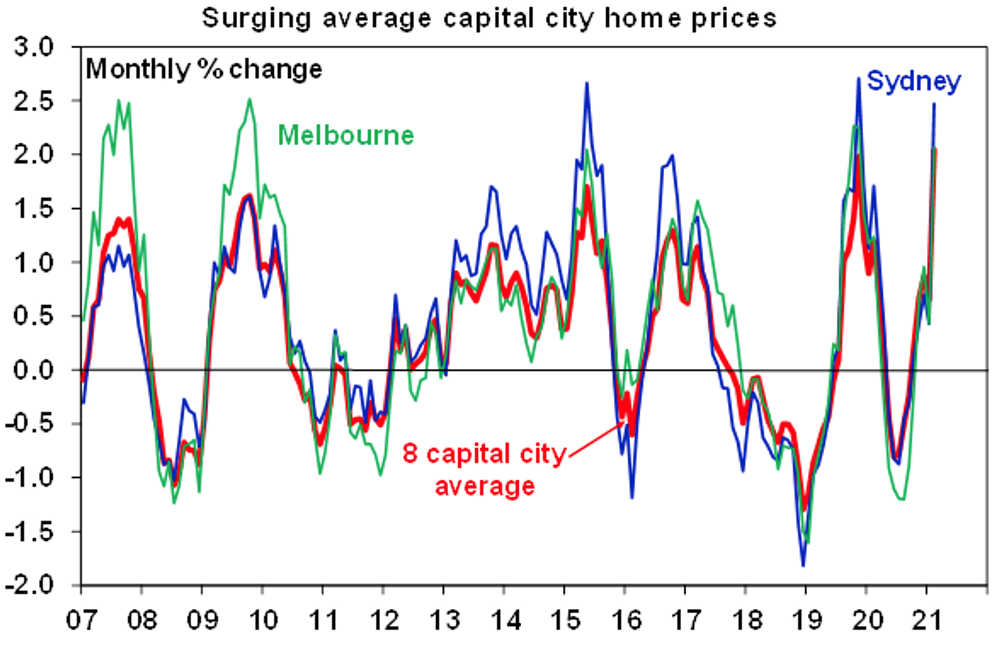
Australian capital city average dwelling prices rose 2% in February according to CoreLogic and are up 2.6% on a year ago. This is their fastest monthly gain since 2003 and they have now surpassed their September 2017 record high by 0.7%.
Sydney dwelling prices rose a very strong 2.5%, resulting in five months of gains, and are up 2.8% on a year ago.
Melbourne prices also rose 2.1%, resulting in four months of gains, but are down -1.3% on a year ago reflecting a -5.6% fall around mid-2020 through the various lockdowns.
Prices in other cities were all up strongly led by Hobart with prices up 2.5% in February and 8.7% through the year, followed by Canberra up 1.9%, Brisbane and Perth both up 1.5%, Adelaide up 0.8% and Darwin up 0.7%. Prices in Hobart, Canberra, Brisbane and Adelaide are all at record highs.
Regional dwelling prices rose 2.1% in February and 9.4% on a year ago with their relative strength reflecting lower levels of indebtedness and hence less vulnerability to the financial stresses caused by the pandemic driven economic downturn, less exposure to the slump in immigration and increased buyer interest as people seek to relocate from cities as part of a secular trend towards working from home and a greater focus on lifestyle.
Capital city house prices rose 2.3% in February and 3.6% over the last 12 months whereas unit prices lagged with a 1.1% gain in the month and a -0.1% fall on a year ago, with the relative underperformance likely reflecting an ongoing shift in lifestyle preferences towards houses as a result of more working from home and a lifestyle choice and as weak rental conditions made worse by the slump in immigration constrain the inner city unit markets in Sydney and Melbourne. Over the last 12 months unit rents fell -8.0% in Melbourne and -5.3% in Sydney, although there were further signs of stabilisation in February.
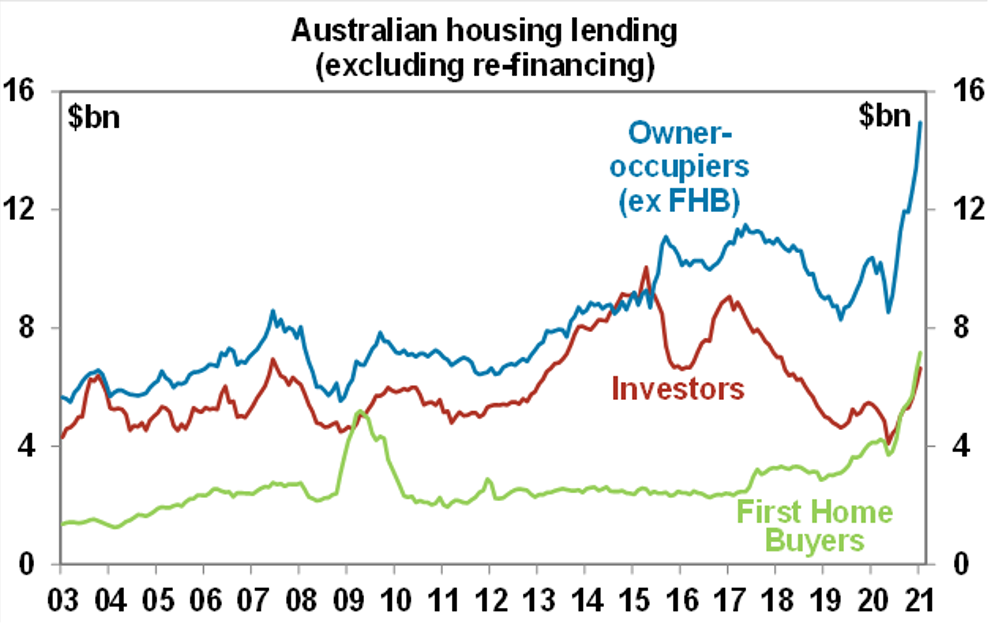
The strength in home prices is consistent with the surge in new housing finance commitments over recent months. This rose another 10.5% in January and is now up 44.3% from a year ago. First home buyer finance surged 10.1%mom - and is up a whopping 73% on a year ago - to a new record high although with owner occupier ex first home buyer finance up an even stronger 11.3%, the first home buyer share of new loans slipped from a record 25% to 24.9%. Investor finance is now also surging and rose 9.4%. The ongoing strength in finance commitments points to more solid house price gains in the months ahead although January’s 2% capital city rise may be hard to beat.
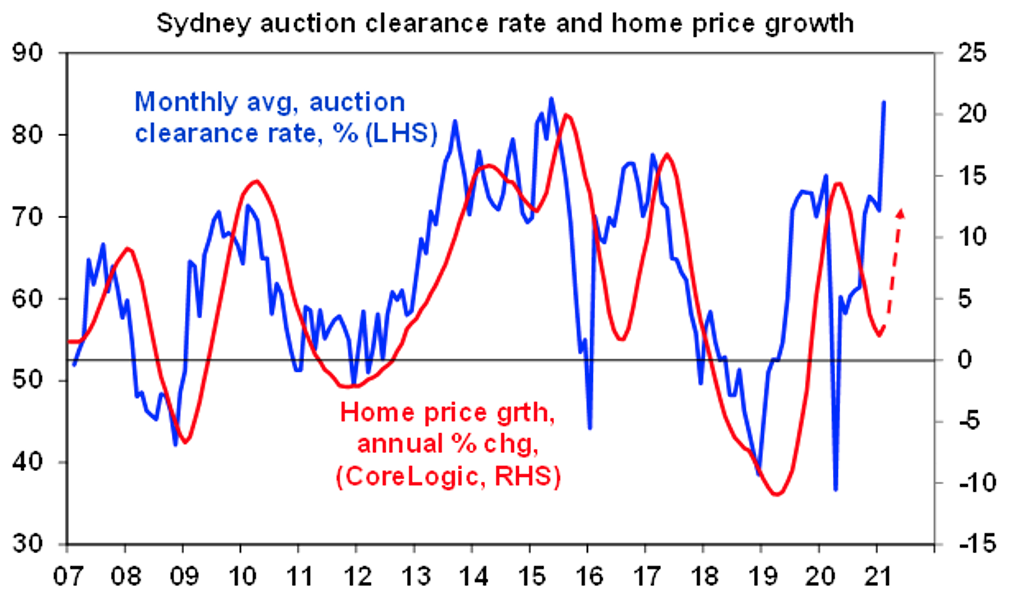
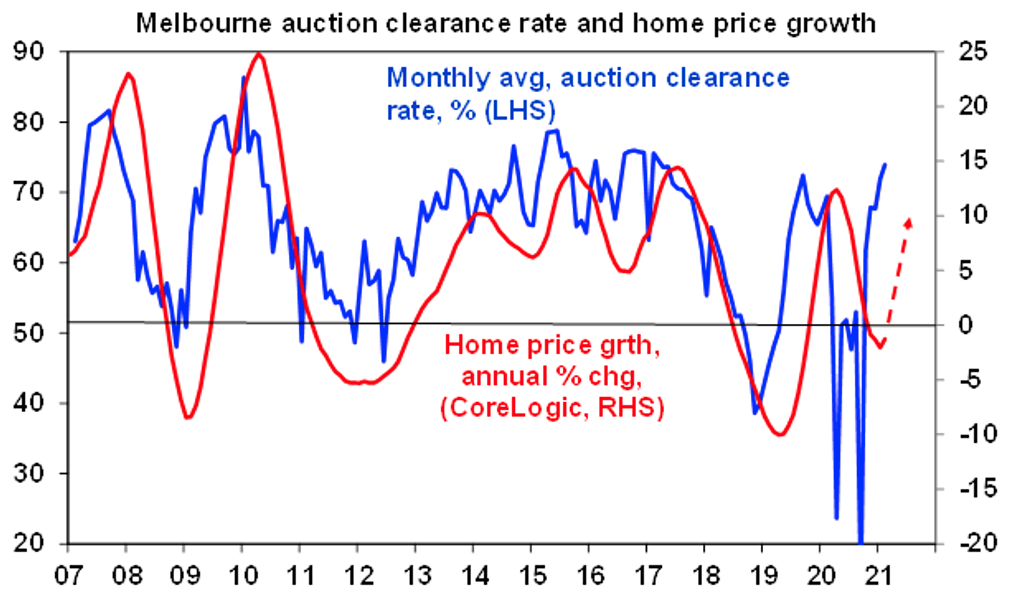
Auction clearances are now very strong and sales are running around pre coronavirus levels, although listings are still relatively low. Clearance rates are at levels consistent with 15% or so annual price gains!
What’s driving the surge in home prices?
The combination of reopening unleashing pent up demand, government incentives, the removal of responsible lending obligations, record low mortgage rates, the desire to "escape from the city" and relatively low property listings are all helping to push prices higher with an element of FOMO (or the “fear of missing out” creeping in too. This is after bank payment holidays and Government income support measures averted a sharp fall in prices that would otherwise have followed from the pandemic recession. The combination has more than offset the impact of weak inner city rental markets and the hit to immigration and has brought forward demand from first home buyers and owner occupiers, with investors now starting to jump in too.
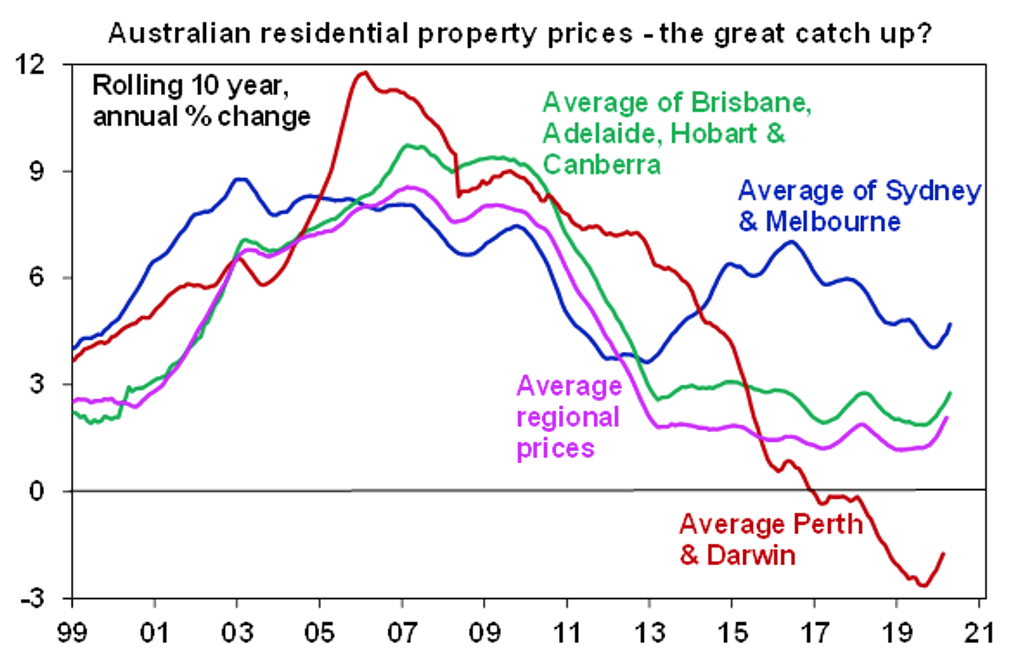
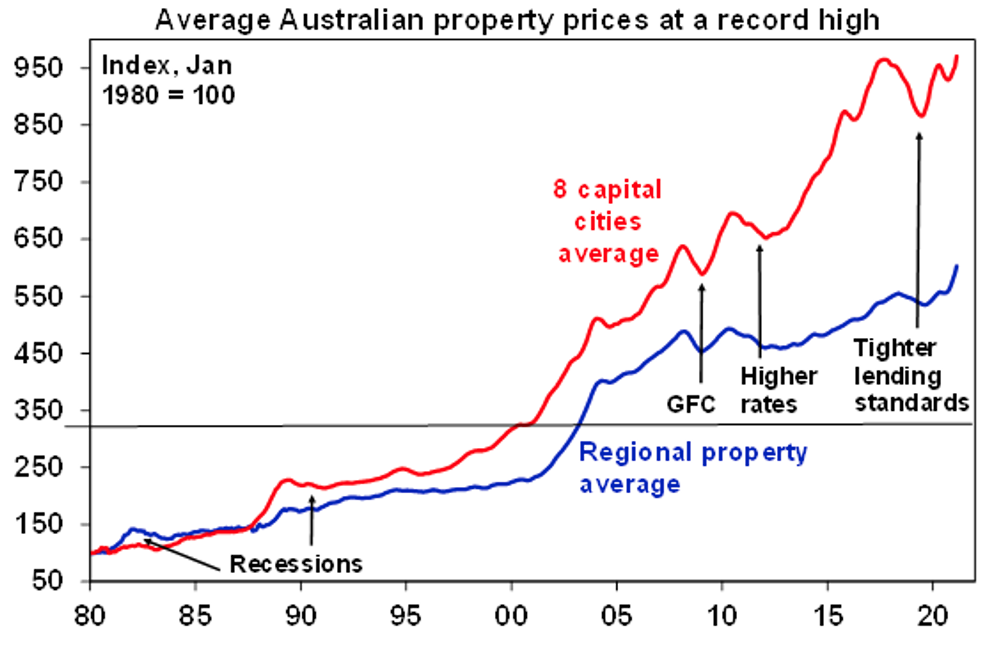
Average capital city dwelling prices have now surpassed their September 2017 high, although this masks a wide divergence with: clear record highs in Brisbane, Adelaide, Hobart and Canberra and in average regional home prices; Sydney and Melbourne still down just over 1% from their 2017 highs; and Perth and Darwin remaining well down on their 2014 highs.
Outlook
Australian home prices are likely to rise another 5% to 10% this year and next being boosted by record low mortgage rates, government home buyer incentives and the recovery in the jobs market but the stop to immigration and weak rental markets will likely constrain price gains in inner city areas and units in Melbourne and Sydney. Outer suburbs, houses, smaller cities and regional areas will see relatively stronger gains in 2021.
The phasing down of government incentives and exhaustion of first home buyers will likely see first home buyer demand as a share of housing finance and overall demand peak in the months ahead but they will likely be replaced by rebounding investor demand. Possible increases in 4 year plus fixed rate mortgage rates flowing from the recent surge in bond yields will act as a bit of a dampener but likely only enough to see price growth settle around a 5-10% annual pace.
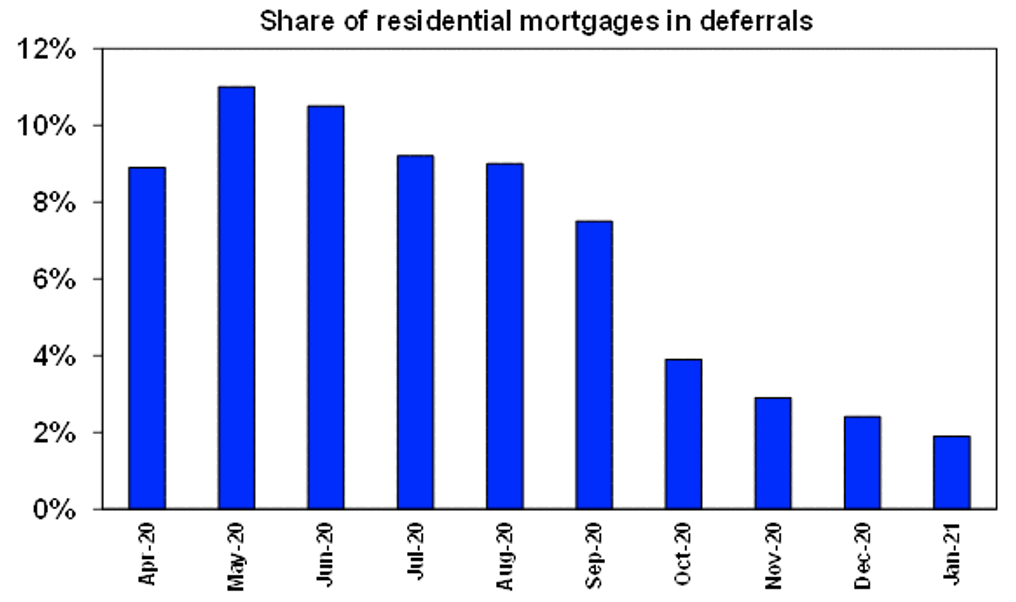
The wind down of JobKeeper at the end of the month and the expiration of home loan deferrals may also act as a dampener to the extent that they may boost forced sales but the impact is likely to be marginal. Reliance on JobKeeper has already fallen substantially (from 3.6 million jobs being protected in September to 960,000 in January) with little adverse impact on the economy and the proportion by value of home mortgages on payment holidays has collapsed from 11% in May to just 1.8% in January.
The acceleration in home prices is likely to be starting to concern the RBA – but with average prices only just surpassing their 2017 high, growth in housing debt remaining relatively subdued at 3.6% year on year (due to the rapid paydown of existing mortgages) and little evidence of a significant deterioration in lending standards at present it and APRA are unlikely to reach for the macro prudential lever just yet – but as prices continue to rise this is likely next year or maybe later this year in the absence of RBA rate hikes (which are unlikely until 2023).
The next chart puts the relative performance of the capital cities into perspective by focussing on rolling 10 year price gains. Right now, Brisbane, Adelaide, Hobart, Canberra and average regional dwelling prices are playing catch up after underperforming Sydney and Melbourne into 2017 and Perth and Darwin home prices are finally recovering from a multi-year bear market that went bust in 2014 with the end of the mining investment boom. The surge in immigration played a big role in the outperformance of Sydney and Melbourne into 2017 and this is now going into reverse.