9 July 2025
1300 794 893

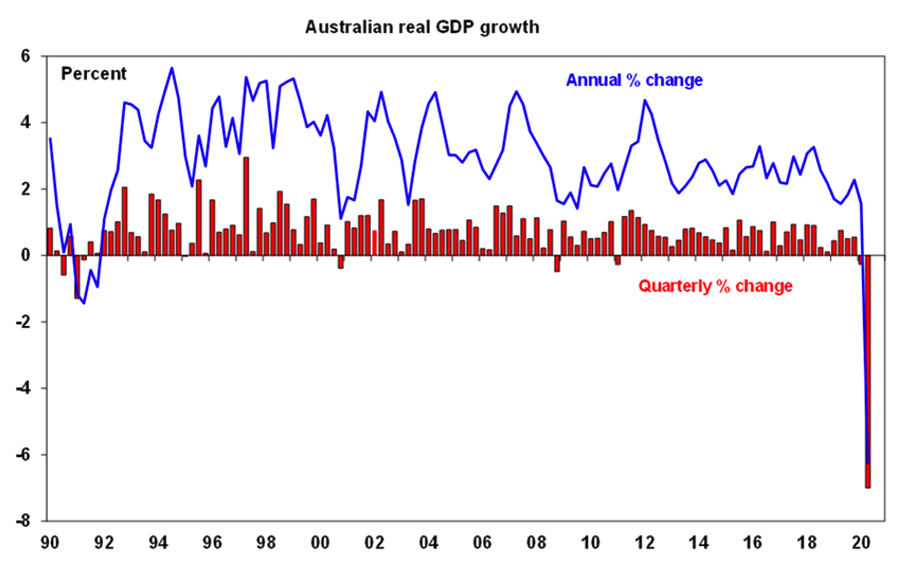
Australian GDP fell by 7% in the June quarter, which was worse than the latest market expectations (the economist consensus was for a 6% decline), but better than had been expected around April when many were forecasting a 10% or so decline. This is the worst quarterly GDP decline on record (the quarterly data only goes back to 1959). But annual GDP growth has declined 6.3%, which looks to be the worst since 1930-31, which saw financial year GDP fall by 9.4%.
And the reason for the huge fall?
The huge fall in production reflects the strict Stage 3 national economic shutdown (which began in late March and extended through April and into May, although there were differences across the states based on COVID-19 cases) and self-regulation by households to alter mobility, which resulted in a record fall in household spending.
How’s retail spending going?
Household spending was the biggest drag on the June quarter data and fell by 12.1% over the period (more than we expected and more than was indicated by the US GDP data) and detracted 6.7 percentage points from GDP. Retail sales have bounced back strongly over recent month but this only accounts for 30% of consumer spending and doesn’t include a lot of services spending. A 17.6% fall in services was the major reason for the huge fall in consumer spending (this accounts for things like travel and recreation services). Goods spending was also down but only by 2.8% because of lower spending on the operation of motor vehicles and clothing and footwear. The savings ratio more than tripled to 19.8%, the highest level since 1974. This reflects the large fall in consumption and the lift in disposable income, from government COVID-19 related welfare transfers. The savings ratio will decline from here, as government benefit payments are unlikely to be repeated and as consumption increases reflecting pent up demand. However, we expect the savings ratio to remain higher than its pre-COVID levels over the next year.
What about property and construction?
Residential construction fell by 6.8% in the June quarter and detracted 0.4 percentage points from growth. And ownership transfer costs (a proxy for real estate turnover) slumped by 18.5% and detracted 0.3 percentage points from growth. Building approvals in July had a strong bounce and some rebound in construction is likely in the second half of the year helped by HomeBuilder but construction levels are unlikely to get back to pre-COVID levels for several years, especially as immigration is basically zero for now and will also be slow to recover.
How’s business investment going?
Underlying business investment (which excludes the impacts of transfers between the private and public sector) fell by 3.5% and detracted 0.4 percentage points from GDP growth. Non-residential building construction fell by 2.3%, engineering construction rose by 1.9% and machinery and equipment was down by 6.9%. Generally, non-residential building and engineering activity are more resilient to cyclical ups and downs because work in these areas is based on a long-dated pipeline of activity. The capital expenditure survey indicated that business investment will likely be very weak over the next 9 months. Mining spending expectations are looking better than non-mining.
Are we selling Aussie goods overseas?
Net exports contributed 1 percentage points to June quarter growth as the fall in imports (-12.9%) was larger than the decline in exports (-6.7%) which mainly reflects the fact that Australians spend more overseas than tourists bring into Australia and this is included as a boost to net exports. Net exports are likely to remain a positive driver of GDP because service imports (Australians going overseas) will remain extremely low while the international border is shut.
Which states fared the worst?
Across the states, the biggest falls in state final demand were in NSW (-8.6%) and Victoria (-8.5%) which is unsurprising given that these are the states that had the highest count of COVID-19 cases and the strictest lockdowns, followed by Tasmania (-7.4%), WA (-6.0%), Qld (-5.9%), SA (-5.8%), NT (-4.9%) and only a small 2.2% fall in ACT.
So we’re in a technical recession?
Yes, today’s data confirms the first technical recession since 1991 as GDP also fell 0.3% in the March quarter. It is still uncertain whether this corona-driven slump ended in the June quarter given that the lockdown in Victoria (worth 25% of GDP) will be a big drag on activity. Our current forecasts assume another small 0.3% decline in GDP in the September quarter which means that the recession will drag on until the last quarter of 2020. While the economy is technically now in recession and some will call it a depression, the current slump is different to past recessions and the Great Depression in two key ways. First it has been caused by a government mandated shutdown of much of the economy as opposed to a cyclical boom leading to a bust which takes a long time to work through as excesses have to be unwound. This downturn was not preceded by a boom unlike the recessions of the 1970s, 80s and 90s and there was nothing like the Roaring Twenties. Second, monetary and fiscal stimulus has been unprecedented and very rapid whereas it normally only occurs more slowly and is smaller. For these reasons the economy should be able to bounce back faster – but of course much depends on getting coronavirus under control.
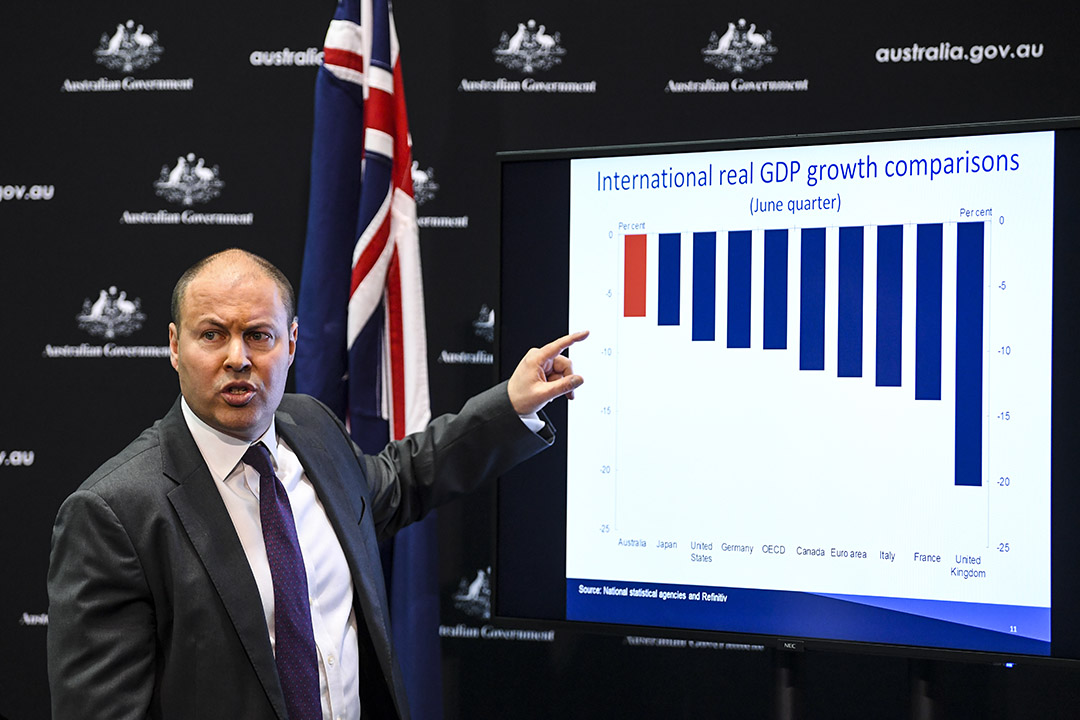
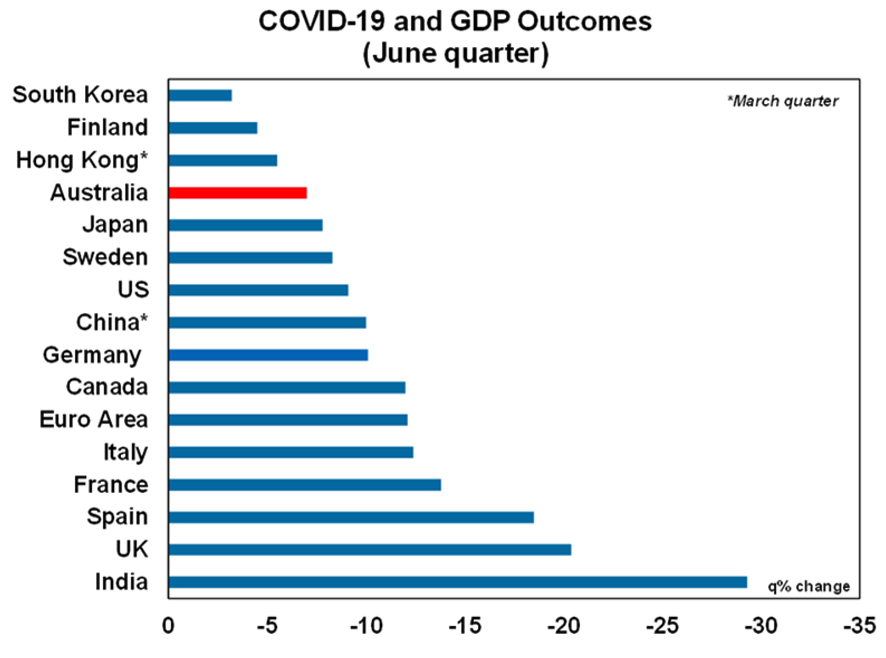
Are we doing better than the rest of the world?
Australia has fared relatively better in the June quarter downturn compared to other countries around the world (see chart below) which all had various levels of lockdowns or restrictions. Australia’s relatively less worse performance reflects its initially better control of the virus, large and well targeted and timely stimulus programs and support for our exports from the earlier rebound of the Chinese economy.
What’s the outlook like?
Given the stricter lockdown in Melbourne since early August and the other restrictions across the rest of Victoria, the outlook for GDP growth in the September quarter is for another negative quarter of growth (albeit a much smaller decline than the June quarter) whereas growth in a lot of other global counterparts (like the US) looks to be in a cyclical upswing as low interest rates and government fiscal stimulus boost economic growth. After this low point in Australian GDP (which we think will be the September quarter), there will be a need to fill the growth pothole left by the COVID-19 pandemic, so the pressure will remain on the Reserve Bank and Federal and state governments to provide additional support to the economy to spur growth.
Federally this is likely to come in the form of a bring forward of income tax cuts and new investment tax incentives to boost consumption and investment, possibly in next month’s budget.
Will interest rates be cut?
We now see the RBA in the months ahead cutting the cash rate to 0.1%, increasing and broadening its bond buying programme and adopting an even more dovish commitment to not raise rates until inflation is actually and sustainably back in the 2 to 3% target band.