1 July 2025
1300 794 893


The latest worry for stock investors is inflation and the US copped a big CPI jump on Wednesday. This is how the Wall Street Journal saw it: “U.S. inflation hit a three-decade high in October, delivering widespread and sizable price increases to households for everything from groceries to cars due to persistent supply shortages and strong consumer demand”.
The inflation number was 6.2%, which is big, but I think big inflation stats will be temporary.
That aside, the reading has many commentators worried that interest rates will rise earlier than expected and that could hit stock prices. This happened around the same time I was having a conversation with one of my financial planning clients, who’s very conservative. In fact, his conservative nature has cost him a lot of money. And by the way, he is conservative because he doesn’t want to lose money!
As I explained, his returns, which were good but not great like other clients, could have been better if he’d accepted our view on stocks after the Coronavirus crash. In saying that, he noted that I was a “perma-bull”, while he was more like a “perma-bear”.
For those not used to these endearing quadruped tags for optimistic investors — bulls — and pessimistic bears, I’d like to add to this education piece by saying history says it pays to be bull-like.
Investopedia says the world’s most important stock market index — the S&P 500 of the top 500 US stocks — has returned 10% per annum over long time periods. And it makes a strong case for bulls, and that’s no bull!
“The S&P 500 Index originally began in 1926 as the ‘composite index’ comprised of only 90 stocks,” Investopedia explained. “According to historical records, the average annual return since its inception in 1926 through 2018 is approximately 10% to 11%. The average annual return since adopting 500 stocks into the index in 1957 through 2018 is roughly 8%.”
But the purists like to downgrade that wonderful 10% return for inflation, which is a fair thing to do. If you do that, then the real return is 7%. Still, if you were lucky enough over a long time to average a 4% term deposit rate at a safe bank, after 3% inflation, your real return for a deposit is 1%.
The difference between a safe deposit and a more risky, yet long-term safe stock market, is 6%!
This is why people venture into the stock market, so they take on risk for better returns. But is a stock market reliable?
Here’s a table of the S&P 500 over 50 years to 2019. While 10 of them were negative, 40 were positive.
S&P 500's Annual Total Nominal Returns
| 2019 | 31.10% |
| 2018 | -4.41% |
| 2017 | 21.94% |
| 2016 | 11.93% |
| 2015 | 1.31% |
| 2014 | 13.81% |
| 2013 | 32.43% |
| 2012 | 15.88% |
| 2011 | 2.07% |
| 2010 | 14.87% |
| 2009 | 27.11% |
| 2008 | -37.22% |
| 2007 | 5.46% |
| 2006 | 15.74% |
| 2005 | 4.79% |
| 2004 | 10.82% |
| 2003 | 28.72% |
| 2002 | -22.27% |
| 2001 | -11.98% |
| 2000 | -9.11% |
| 1999 | 21.11% |
| 1998 | 28.73% |
| 1997 | 33.67% |
| 1996 | 23.06% |
| 1995 | 38.02% |
| 1994 | 1.19% |
| 1993 | 10.17% |
| 1992 | 7.60% |
| 1991 | 30.95% |
| 1990 | -3.42% |
| 1989 | 32.00% |
| 1988 | 16.64% |
| 1987 | 5.69% |
| 1986 | 19.05% |
| 1985 | 32.24% |
| 1984 | 5.96% |
| 1983 | 23.13% |
| 1982 | 21.22% |
| 1981 | -5.33% |
| 1980 | 32.76% |
| 1979 | 18.69% |
| 1978 | 6.41% |
| 1977 | -7.78% |
| 1976 | 24.20% |
| 1975 | 38.46% |
| 1974 | -26.95% |
| 1973 | -15.03% |
| 1972 | 19.15% |
| 1971 | 14.54% |
| 1970 | 3.60% |
And this chart — my favourite — shows what happened to $10,000 over the time 1970 to 2009, just after the GFC.
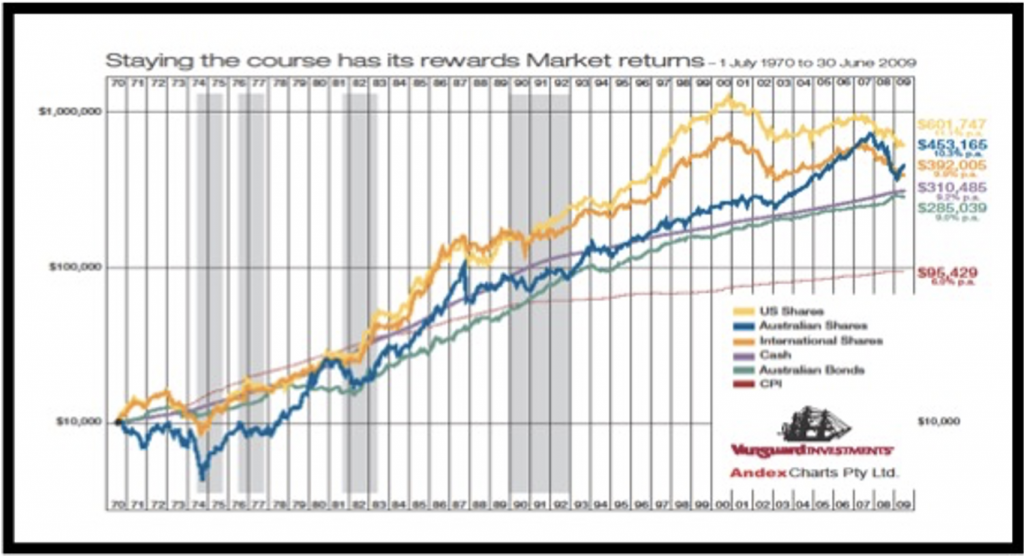
These numbers assume no tax and a total reinvestment of dividends but it still makes a really good point that if you reinvest your dividends and invest in super with a low tax slug, you can really make serious money out of the stock market. That $10,000 invested in 1970 went to $453,165 by 2009, despite four or five big crashes between 1970 and 2009.
For the nervous bear investor, this chart shows why I like stocks better than term deposits. This pits the CBA dividends versus the return from a term deposit in 1992 to 2016, assuming a pretty high interest rate on a deposit could’ve been sustained.
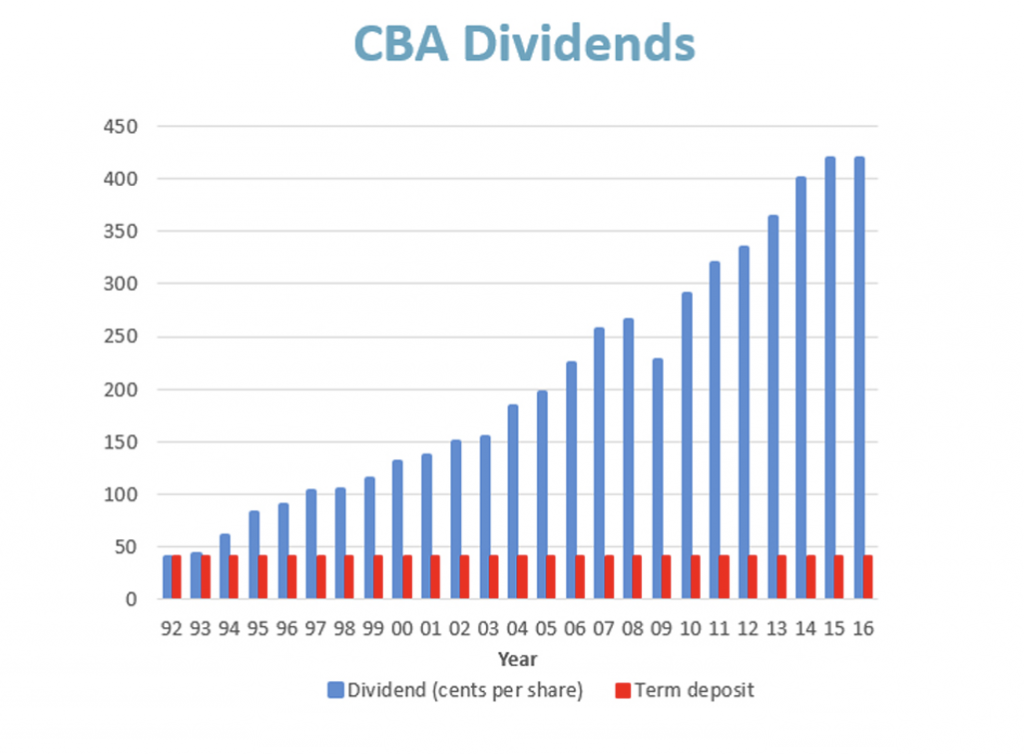
Not only do stocks allow you to grow your capital, while a term deposit preserves it, the income pay-off from a stock like CBA via dividends, or even by an ETF for the S&P/ASX 200 index, would beat most interest rates on deposits in most years as well.
Between 1992 and 2016, which the above chart covers, the CBA share price went from about $6 to $76. It now is $108! If your money was put into a term deposit the capital value would be the same.
For those worried about a really bad time for an economy, with a long recession (when the stock market might be negative for a sustained period), the 50-year chart above shows that only between 1973 and 1974, as well as between 2000, 2001 and 2003 (the dotcom bust years in the US) did we see multiple years of negative stock market returns.
Despite those three bad years for stocks, $10,000 in the Australian stock market was able to ride up to over $450,000, even after the stock market crashed 50% in 2008!
For the nervous investors, say with $1 million in super, they could sock away four years’ worth of living on $100,000 a year ($400,000) for really bad times and then invest $600,000 totally in stocks, which would give these nervous nellies the chance of big returns over a decade, averaging 10% per annum. This could mean the $600,000 could double in seven years. Meanwhile, the $400,000 could only grow at bank deposit interest rates pace, but that’s the price you pay for being a nervous, pessimistic bear.
What if the bull investor simply put the $1 million into an ETF tracking the S&P/ASX 200 Index? It’s likely that the capital would grow at 5% on average and the dividends at 5% plus franking. That’s what history would suggest, but the bull would have to live with their capital going up and down like this chart of the ETF — IOZ — below.
ETF: IOZ 2011-2021
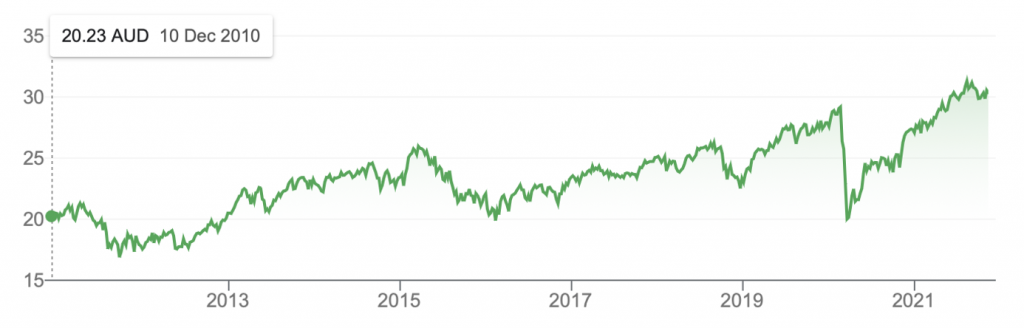
The IOZ ETF gives you the top 200 listed companies in Australia in one trade or ‘stock’ (hence IOZ) and its unit price went from $20 to $30, between 2011 and 2021, which is a 50% gain over 11 years, which is close to 5% per annum and the dividends average a bit under 5%.
The bull has to be patient and capable to sleep during nights when the markets fall, which can be hard because stock markets rise by the stairs but fall by elevators!
All my confidence in stocks does rest on the belief/hope that modern economic policy can beat Great Depressions, as we saw in 2020 with the Coronavirus crash of the stock market. I could be wrong about ruling out a Great Depression, so what happened to stocks over the Great Depression of the 1930s?
I looked at the years 1928-42 and the stock market’s ups and downs are seen below:
| Year | Market Gains/Losses |
| 1942 | 20.34 |
| 1941 | -11.59 |
| 1940 | -9.78 |
| 1939 | -0.41 |
| 1938 | 31.12 |
| 1937 | -35.03 |
| 1936 | 33.92 |
| 1935 | 47.67 |
| 1934 | -1.44 |
| 1933 | 53.99 |
| 1932 | -8.19 |
| 1931 | -43.34 |
| 1930 | -24.90 |
| 1929 | -8.42 |
| 1928 | 43.61 |
Out of the 15 years, nine were negative and six were positive. But it was a Great Depression! What happened to $1,000 over that time, including dividends?
Over the 15 years, the $1,000 roughly went up to $1,430 in 1928, fell to $512 by 1932, recovered to $1528 by 1936 and then dropped to $944 by 1942. After that, the post-World War boom kicked in and stocks surged.
From 1942, stocks went up 20.34%, 25.9%, 19.75%, 36.44%, down 8.07%, up 5.71%, 5.5%, 18.79%, and 31.71% in 1950.
Sure, the capital did go up and down and was a little less than it was in 1928 — $1000 versus $944 — but it was a Great Depression and the boom that followed in the 1940s was huge.
The year 1941 was a critically important year for one of the best stock market investors ever — Warren Buffett. “At 11 years old he made his first investment, buying three shares of Cities Service Preferred at $38 per share. The stock quickly dropped to only $27, but Buffett held on tenaciously until it reached $40,” biography.com tells us.
How long does Buffett stick to stocks? Forever! As he once said: “[Our] favorite holding period is forever. We are just the opposite of those who hurry to sell and book profits when companies perform well but who tenaciously hang on to businesses that disappoint. [American investor] Peter Lynch aptly likens such behaviour to cutting the flowers and watering the weeds."
You can never rule out bad periods for stocks but if you buy quality businesses that pay dividends and you buy 15-20 of them, you and your nest egg will stand the test of time. All you have to do is be a believer in quality companies and be patient.
But what about the inflation concern? Well, I agree with JPMorgan’s CEO Jamie Dimon that this inflation is supply chain driven and these supply problems will ease in coming months as vaccination rates, open borders and greater steps towards normalcy kick in.
But even if the US central bank moves earlier than expected and the stock market gets scared and sells off, it will be a short-term reaction. History shows it will take a few rate rises before the cost impact of higher rates KO the pluses from the strong growth expected in 2022.
There could be short-term sell offs but these will be buying opportunities for the sensible long-term investor.