1 July 2025
1300 794 893

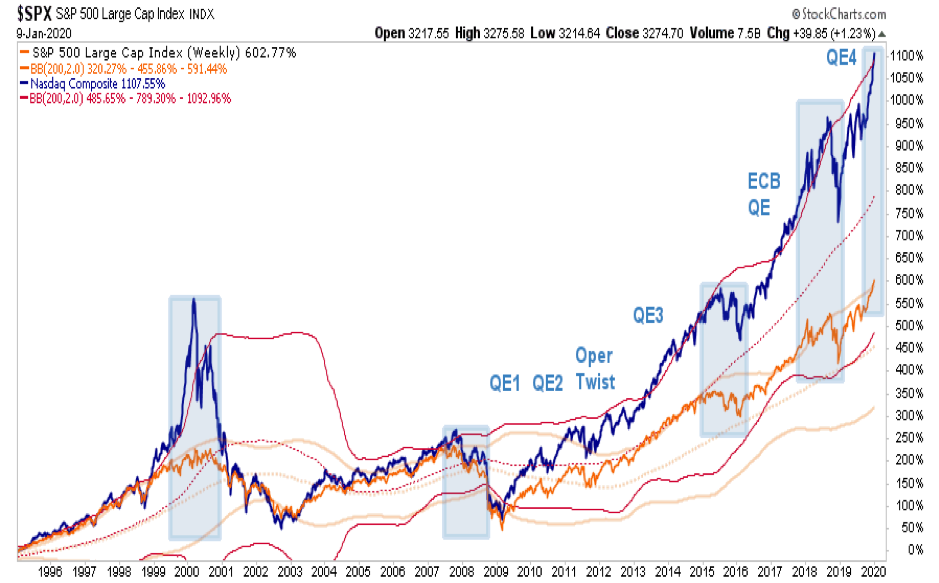
World share markets including Australia are primarily driven by what happens on Wall Street because America’s market accounts for over half the global market. It’s the elephant in the room. Turning points in the Australian All Ords share price index closely follow those of America’s S&P 500 index.
CLICK HERE to take a free 21 day trial to the Switzer Report
The media focuses on Trump’s trade war with China, Johnson’s Brexit victory and Trump’s latest showdown with Iran. These cause ripples on Wall Street but not waves. The real force since the end of the global financial crisis in 2008 has been LIQUIDITY. Whenever the Federal Reserve has added to bank cash reserves by buying government bonds or other securities, the US stock market has soared. And whenever it has stopped doing so the market has corrected.
If you don’t believe me, look at the next chart that traces the history of Quantitative Easing (liquidity creation) since the GFC. The blue bars mark when liquidity was tightened and the unshaded parts when it was expanded. Ignore the last blue bar because QE4 (going under a new title “Repo Purchases”) has still not ended.
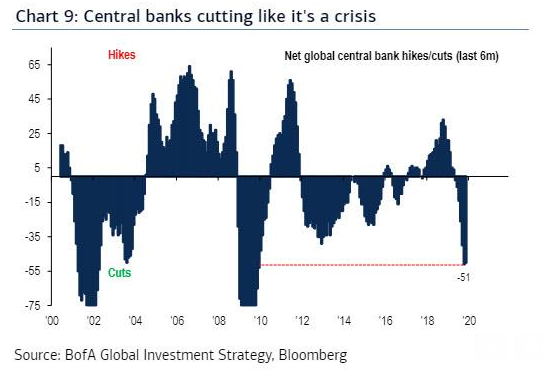
Around the world central banks mimicked the US Federal Reserve in expanding or tightening liquidity and lowering or raising official cash rates. The next chart shows how all central banks as a group have hiked or cut rates for the past two decades. Note how market corrections or crashes (2000, 2008, 2011, 2016, 2018) were preceded by rate rises Each liquidity burst was accompanied by a fall in the official cash rate and each liquidity pause was accompanied by a rate rise.
In fact, the Federal Reserve has QE4 on full throttle since September last year as can be seen by the red line in the next chart. The recent dip in bond purchases is seen as a brief pause, not a change of direction.
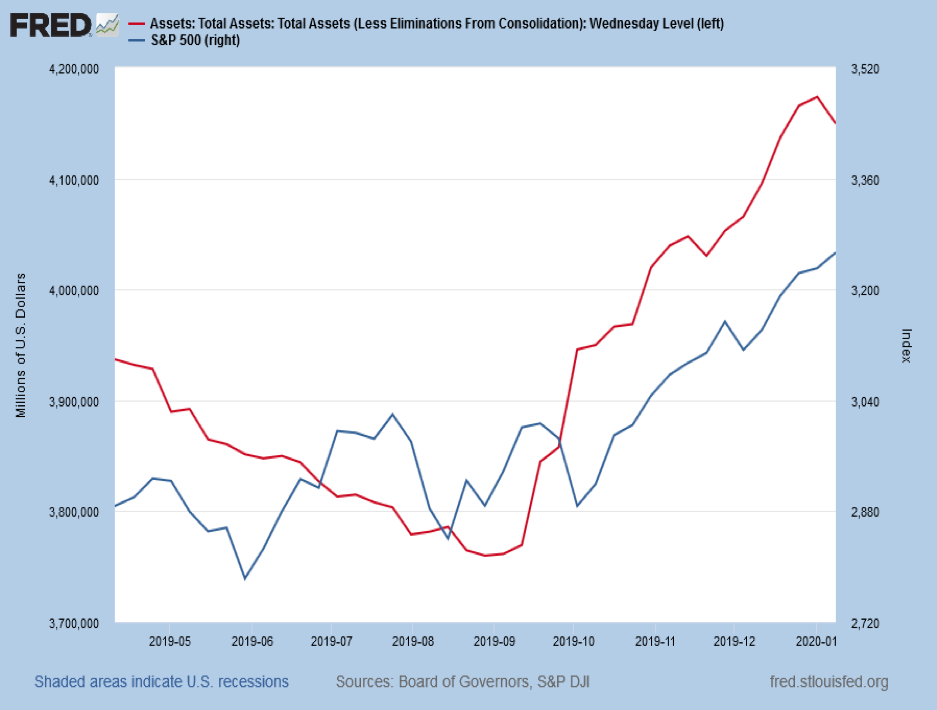
This suggests the US share market’s current melt-up will continue until the Fed slows down or stops its money printing or something else occurs that precipitates a credit squeeze.
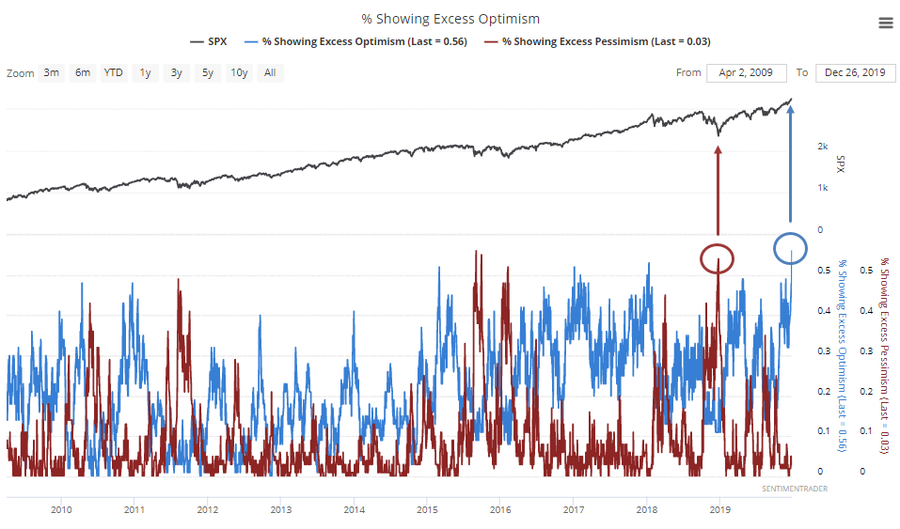
Indeed, market optimism late last year reached its highest point in a decade according to Sentiment Trader, the mirror opposite of a year ago when market pessimism spiked. See next chart.
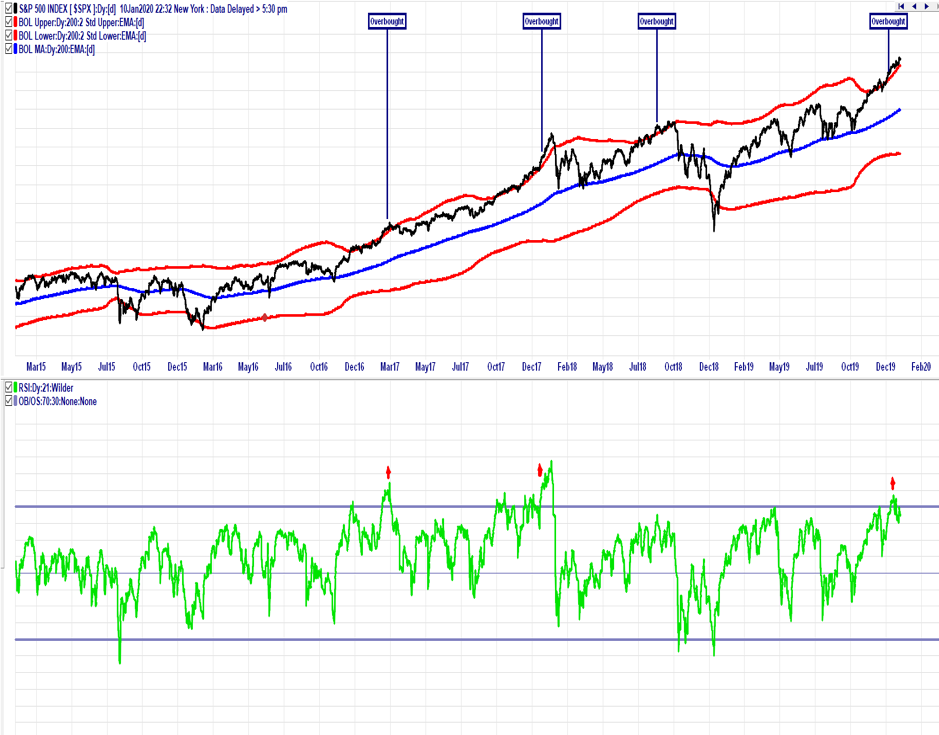
Of course, the sheer take-off in the US stock market could trigger its own pullback. The upward thrust has reached extremes in terms of both its deviation from long term trend and its relative strength over a shorter period. See next chart. Whenever this has occurred in the past the market usually retreated within a month or so of it happening which would suggest that might be imminent. Such a stumble would most likely encourage the Federal Reserve to keep pumping money into the economy, thereby fuelling the bull market further.
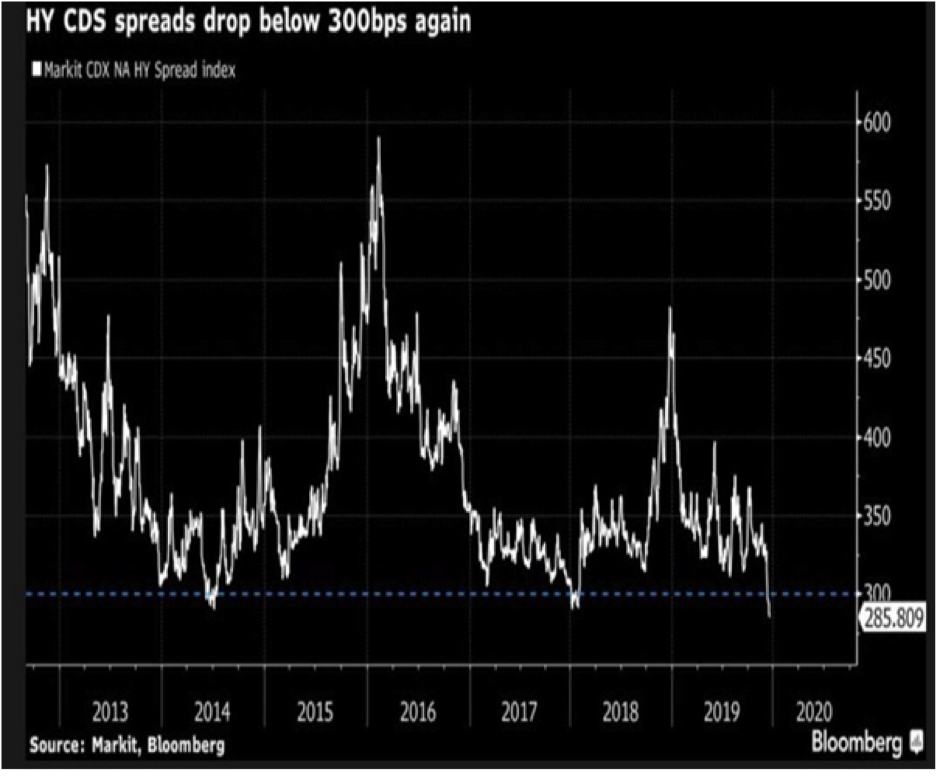
Also at present there is incredible shareholders complacency towards risk. For instance, the difference (spread) between the high yield (junk debt) CDX index and U.S. Treasury yields has fallen back below 300 basis points. That last occurred in early 2018 and mid-2014 and indicates investors are prepared to chase extra yield by buying junk bonds, even if they return little more than government-backed bonds.
Another illustration of investor complacency is the historically low PUT/CALL ratio. This reflects the number of “put options” being bought on the S&P 500 (to hedge risk) versus the number of “call” options purchased (to “lever up” risk.)
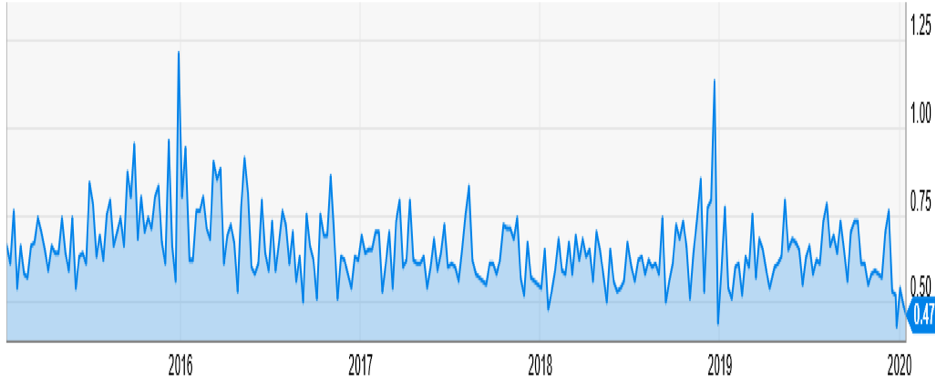
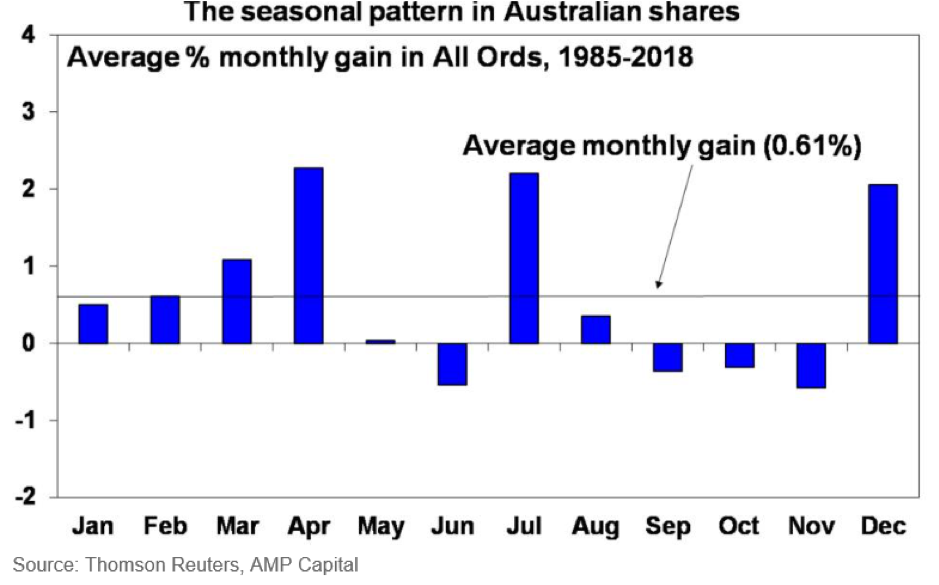
So in the near term, expect a stock index pull-back of 5% to 10%, but not a correction or crash in excess of this unless the Federal Reserve announces its Repo Purchases are over or Middle-East tensions see oil prices soar. Also the period from October to May is normally bullish for US shares as shown in the next chart.
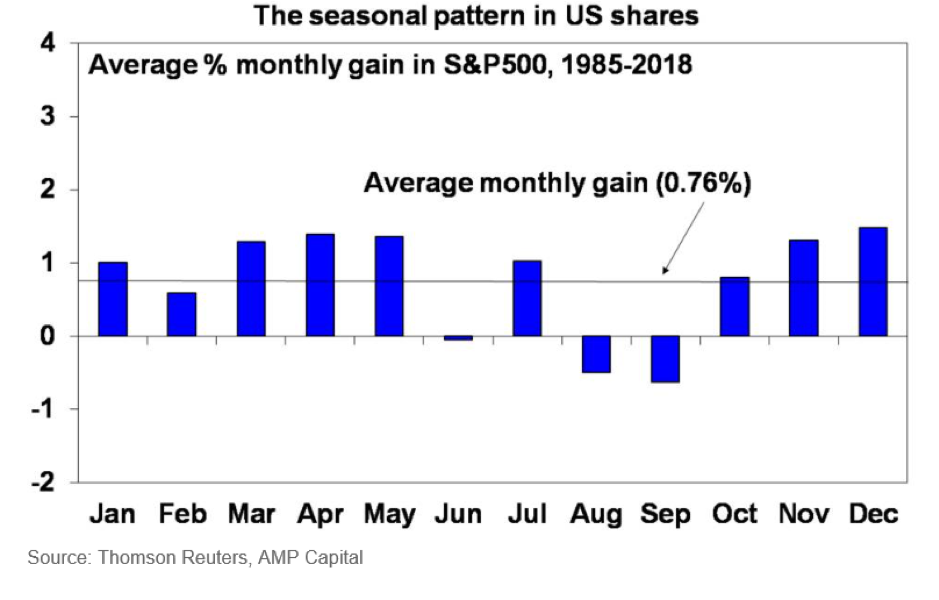
This pattern also occurs in Australia though the period is shorter (just December to April) according to Shane Oliver of AMP Capital.