4 July 2025
1300 794 893

Those investors who fail to identify emerging market trends and themes may well fail to capture the rewards on offer from investing in the development of embryonic businesses and industries. It is arguably too late for investors to latch on to these names only once they’ve become large constituents within notable indices, with much of the optimism already embedded into the share price.
Just because a company is large and well-known today, doesn't necessarily mean it'll remain that way into the future. Equity investors need to overcome familiarity bias and focus on the future, what is to come rather than what has happened in the past.
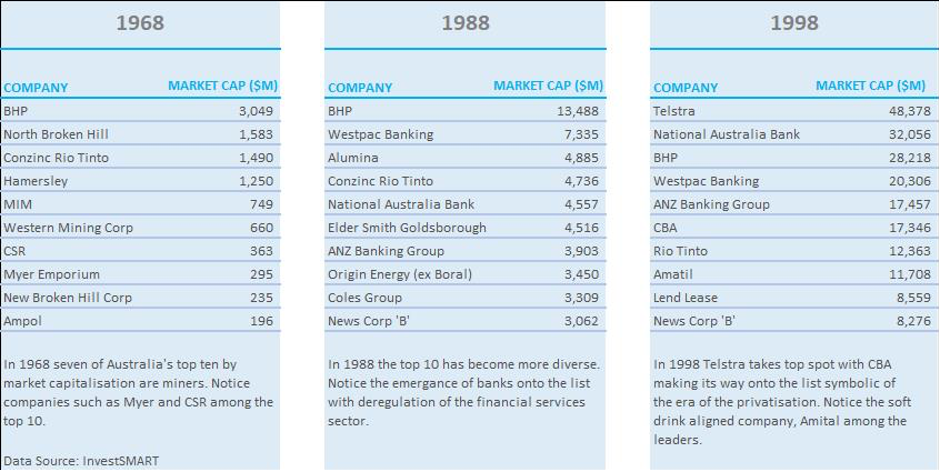
The below table outlines the evolution of Australia's top 10 listed companies since 1968.
The innovation gap widens
Macquarie research stated recently that the gap between the more innovative corporations and the laggard ‘old-world’ business continues to widen. Comparing today’s modern era with historical periods of great progression, such as the emergence of Railroads in the 1880s and the arrival of the Automobile led by Henry Ford in the 1920s.
One particular OECD study highlighted the productivity of the top 5% of firms in any industry is now growing at 4-5x faster than the productivity achieved by some of the laggards.
As such, it’s not surprising that Increasing proportion of the ‘winnings’ are going to a decreasing proportion of companies within industries. Whether you love them or hate them, think there overvalued or fairly-priced, you only have to turn your attention to the FAANGs (Facebook, Apple, Amazon, Netflix and Google) and Australia’s own WAAAX stocks (Wisetech, Appen, Afterpay, Altium and Xero) for evidence of this evolution playing out within equity market markets.
The age-old debate — Value v Growth
After 12 years of “Value” strategies underperforming “Growth” strategies in the US, naturally much has been made of the diverging fortunes, with commentators and investors intellectualising as to whether the trend is sustainable, or likely to see a reversal.
There is little doubt many of the best performing businesses globally look ultra-expensive based on traditional valuation metrics, yet somehow their prices continue to push even higher. On the flipside of the coin, many businesses that are typically considered “value” opportunities with low PE multiples have broadly speaking been amongst the poorer performers.
The question is: what’s causing the divergence in performance, and is it simply a matter of growth strategies being in vogue?
A deeper look at the underlying performers appears to reveal some underappreciated elements driving the trend.First things first the story isn’t as simple as “Value” vs. “Growth”. As highlighted in the chart provided below by Morgan Stanley, it appears to be equally as much about “Low-Quality” v “High Quality” businesses.
The question many value investors need to continually ask themselves is: “Is this a quality business truly exhibiting ‘value’, or is this business simply ‘junk’ and cheap for a reason?
The reality is whether a company was High PE or Low PE has had little bearing per se, with the distinction between the two being somewhat overstated. The fact is that in many cases, quality businesses exposed to capital-light growth sectors have continued to demonstrate strong momentum in both the balance sheet (quality) and share price have been outperforming those ‘cheaper’ businesses in more traditional capital heavy sectors.
Rightly so, the market focus has been on the merit of a result in isolation, rewarding businesses that have exceeded expectations, while harshly penalising those businesses that have missed expectations.
There is one final point worth raising when comparing the performance of ‘growth’ and ‘value’ strategies vis-à-vis. Many quality growth businesses that have emerged in recent decades (and I again refer to the FAANGs and WAAAX for demonstration purposes only) are capital-light in nature, and have management teams that have reinvested revenues to drive future growth at the expense of short-term earnings.
What use is a Price to Earnings (P/E) or Price to Book (P/B) ratio as a value measure when the E has been artificially driven lower, and the businesses don’t possess many tangible assets?
For these businesses, the argument is that today’s investment will deliver a high multiple on the invested capital over time.
As for the so-called ‘Value’ businesses, often these are asset rich businesses that require large fixed capital investments to service and expand their large asset base generate revenue growth, and indeed just to maintain a steady state.
Traits of ‘Quality’ Growth Businesses
Capital light
As touched on above over the past decade, companies have moved increasingly toward capital-light business models where a simple idea is enough to generate economic value without the need for much physical capital. The composition of market indices away from heavy manufacturing towards sectors such as information technology is undeniable, and investors need to decide whether they can ignore this structural change in the economy and the market?
Intangible assets
An interesting piece of research by one of the world’s largest fund managers, DWS group, suggests that since 2007 approx. 40% of the current global equity market has seen zero earnings growth since the financial crisis, with the real position masked by quantitative easing, share buybacks and cost-cutting.
Negative earnings growth was attributed to companies not investing early enough in intellectual capital, which includes other intangible things such as human capital and Intellectual property.
The team goes further to highlight that companies with intangible assets have almost doubled their earnings and their market capitalisation has followed, while the market capitalisation is unchanged for those without intangible assets.
Low churn
Most businesses experience what’s called customer Churn. This is the scenario where a customer ceases their relationship. Naturally the lower the churn rate the better for any business. In some circumstances, businesses can achieve a negative churn rate. This phenomenon is achieved when a company loses customers, yet the additional revenue generated from the existing customers collectively increases by more than the amount lost from to the departing customers all without having to replace the customers who have left.
The holy grail for businesses is being able to increase prices, and increase customer spend without losing clients or customers.
High margins
A common trait of quality high growth businesses is that they exhibit high gross margins. It goes to say capital light businesses with low levels of tangible assets typically have high margins. Conversely, the incumbent mature businesses typically associated with financial markets tend to be more capital intensive with large tangible asset bases. These businesses often operate on slim margins which in the event of an economic downturn can rapidly see profits evaporate as top-line revenues compress.
High free cash flow
A resulting feature of businesses moving increasingly toward capital-light business models has been a sizeable jump in the amount of free cash flow (FCF) generation and return of capital (ROC) in the form of dividends and buybacks. As a general rule, dividends and buybacks overtime will equate to a company’s free cash flow. As such, a disproportionate emergence of capital-light businesses has seen an increase in the amount of capital being returned to shareholders, an increase that is not reflected when looking at earnings.
The divergence of free cash flow relative to earnings explains why these valuation metrics are so depressed while P/Es are above their long-term averages. Mulitples such as Price/FCF and Price/ROC are now trading at substantial discounts to historical averages as companies look to invest money today in the hope of capturing a greater number of customers in the future.
Sacrifice profitability for growth
High-quality growth businesses often sacrifice profitability for growth. That is if management have the capacity to efficiently invest a dollar of today's revenue in opportunities that enhance future profitability. By repeating this consistently and successfully management can ultimately deliver compounded value-enhancing growth. An obvious example of this is invetsment in things such as research and Development (R&D), and marketing.
Hypothetically and well-placed investment in R&D can eventually produce a better, more indispensable product that delivers higher margins, while a successful marketing campaign may unearth new customers who become incrementally growing annuity streams as is the case with many Software-as-a-service (SaaS) firms.
The point, of course, is none of this is reflected on the balance sheet immediately often distorting investor perceptions of value. The benefits transpire over time by which time management has already repeated cycle.
Growth at any price?
Despite the attractive attributes that many of these high-quality growth companies possess investors as with all forms of investing still need to be cautious when looking at opportunities in these growth sectors. Investors need to be careful not to get caught up and mistake momentum as recognition of quality, and ensure they continue to look for quality growth at a reasonable price.
Although over the past 10 years has been there has been outperformance of companies with high quality attributes and strong growth, the reality is that it has been the outperformance by a small number of “high growth/return” stocks (WAAAX And FAANGs) that have skewed results in favour of ‘Growth’ over ‘Value’. On an equal-weighted basis the results are less favourable, with the average “high growth” business actually underperforming a ‘Value’ approach.
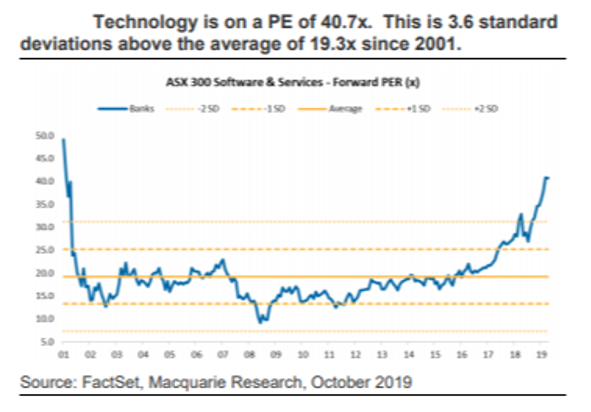
Prior to the crisis research by Goldman Sachs shows that High Growth and High P/E companies in Australia, as defined by EPS growth above 20%, were trading at exorbitant 12-mth forward earnings well above the long-term average and above the lofty levels reached the height of the dot-com boom. In addition to trading at a ~135% premium to the market P/E, Australian growth stocks were trading on a multiple that is more than 60% greater than its international peers.
That’s not to say some of the businesses that make up those readings aren’t worth those multiples having continuously proven doubters wrong. However, investors obviously need to proceed with caution with numbers deviating so obviously from historical averages and global peers.
One stock that fits the bill
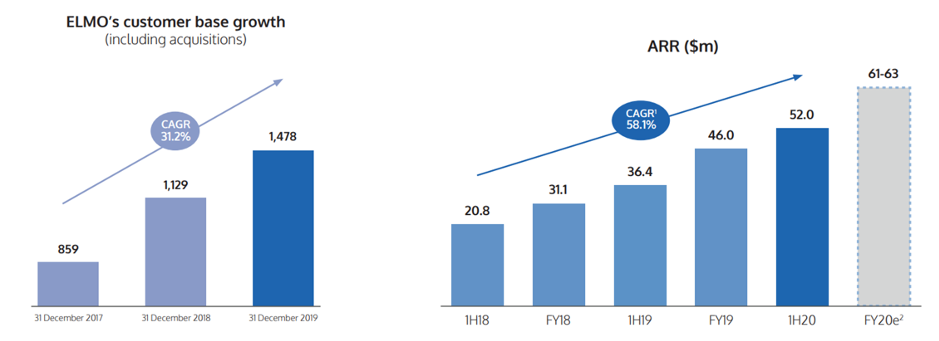
Elmo is a rapidly growing HR Tech company providing cloud HR, payroll, rostering and attendance management technology to approximately 1478 companies primarily throughout Australia and New Zealand. The company was founded in 2002 and operates its cloud-based software under a SaaS (Software as a Service) model with approximately 300 employees and 6 offices.
While Elmo is growing rapidly and now hold an impressive estimated 9% of their total addressable market in ANZ, we are particularly interested in the large addressable market opportunity, which is estimated at a figure of $1.7 billion or ~13,000 organisations.
As always with investments, our preference is for a management team with ‘skin in the game’ and founder involvement given our belief that it improves the chances that the interest of management is aligned those of shareholders. The CEO, Danny Lessem is one of the co-founders of the business, while the other founder still holds a significant stake in the business and maintains a family involvement with the firm. All up, the founders and executive team retains over 30% ownership of the company.
Large, well known clients and high retention
We are also heavily encouraged by the types of companies who are currently working with Elmo across a wide variety of sectors, including the likes of the Australian Government, IBM, Kmart, Healthscope, Sonic Healthcare, RMIT, Macquarie University, Komatsu, Cbus, Toshiba, Hyundai and Fujitsu. Not only are these very well-known brands, but as of the most recent report, ELMO also boasts a low churn rate with an impressive customer retention rate of 93.6% Of equal, if not greater importance is the 110.7% customer dollar retention aided by gross profit margins of 84.6%. This indicates the business has been successful at cross-selling additional capabilities to the existing customer base.
Although large household names make for good reading, it’s the small to medium-sized businesses of 50–200 employees that offer the greatest opportunity for penetration and cross-selling opportunities.
Acquisitions open up additional markets
The company now boasts 13 offerings to clients of which the average customer only takes up 2.6 of. That, therefore, opens up an opportunity to boost sales not only through growing market share with brand new customer additions but also by cross-selling other modules to the existing client base. Early signs are this is beginning to play-out with the average number of modules for new sales during FY19 lifting 3.9, above the average across existing clients.
Opportunity ahead
Overall, ELMO is consistently growing their offerings and customer base, both organically and through targeted acquisitions. Given their steadily growing footprint, large market opportunity and quality offering with extremely high customer retention, we are more than happy to hold positions in this quality SaaS business at a price which is approximately 25% off the 12-month high of $8.51 at the time of writing.