6 July 2025
1300 794 893


In Part 1, I recounted the story of a client of mine, John. He was a long-term investor in the share market, but he just wasn’t getting the type of results that he needed. I highlighted some of the common misconceptions out there when it comes to buying shares. I also gave an introduction to how I like to select stocks and how to help time your entry points more effectively.
However, buying is only part of the equation. The other part, of course, is knowing when to sell.
I would go as far as to say that the split in terms of importance is not 50-50. I would say the most important skill is knowing when to sell.
You can toss a coin and have a strike rate of only 50% which are winners, but you will still grow your portfolio if you are disciplined in selling. You can focus all your energies on picking some brilliant stocks. However, that will count for nothing if you get out too early, or you have another stock in your portfolio that is falling like a stone.
I have seen this many times when conducting portfolio reviews for prospective clients. I have heard plenty of stories where clients picked Afterpay or CSL very early on but took a quick profit instead of achieving life-changing profits. Yet these same people often have a couple of stocks in the portfolio that have shed most of their value.
We have all heard of “hang onto your winners, sell your losers” but it is clearly easier said than done. The problem with holding onto losers is both the mathematics of what it does to your portfolio and the effect that it has on you psychologically. From a mathematical standpoint, we need to ensure that our risk/reward is favourable in order to make progress. If we are happy to take profits at 5- or 10% but hold onto a “good business” if it falls 20-40%, then you will never make progress. I see this strategy too often, and it is a losing strategy.
The other mathematical point that many forget is that it becomes harder and harder to recover from a loss the worse it gets. Cutting a position at a 10% loss means that you only need to gain 11% in your next investment to break even. A 25% loss requires 33.3% returns to break even. And a 50% loss requires a 100% return to break even.
How many 100% returns are you getting? Assuming that you can pick plenty of stocks that will give you a 20% return, you will need to get your dud investment that halved in value to return 20% and then roll that over into another 20% winning trade and continue on a couple more times to get your money back. So you need 4 stocks that return 20% on the trot to break even. To break even! That is before you can even think about making any profits.
Then there is the psychological effect of holding onto losers. My experience with investors is that the more a stock loses, the more reluctant they are to sell it. I hear things like “keep it in the bottom drawer”, or “it's too late now”, and “I’m happy to hold it long term” to justify what has been a bad investment. And we all make bad investments, by the way, it is part of the territory.
Often by the time that there are enough fundamental reasons out there to sell a stock, most of the damage has already been done. I have heard many investors decide to hold onto shares that are heading south because there was no “fundamental” reason to sell the stock. They were losing capital because of the “market” being a bit silly. In many cases, there was a fundamental issue but that didn’t become apparent until later. By then, the investor is back to making excuses such as “it's too late now to sell”, or “the business isn’t going broke, it can be turned around” etc.
The market isn’t efficient, as the textbooks would have you to believe. And stock prices do not go up and down just because of company earnings. Not only is emotion a factor, but as we have seen recently, interest rates and Quantitative Easing also have a big part to play. You can spend your whole life trying to understand the market to only come to the conclusion that you still know nothing. When you realise this, you start to think in terms of probabilities, not absolutes. You tend to move from having “conviction” to managing risk.
Let’s have a look at a real-life example.
Appen (ASX: APX) is a global tech company focused on AI solutions for some of the globe’s largest businesses. At its peak in 2020, it had a market cap of over $4bn. Along with other Aussie tech businesses such as Afterpay, Altium, and Xero, it was a market darling. After its half-yearly results in the middle of August 2020, the share price fell 20% - in one day.
Of the 4 analysts whose specialty is in analysing these businesses, at some of Australia’s largest stockbroking firms, one dropped their target by $1, but the other 3 raised it. After this big sell-off, the average price target was 9% above the share price. That is a 20% decline in the share price which made Appen become quite cheap. It was a buying opportunity according to the professional analysts.
We have to remember that analysts at large firms are specialists in analysing these businesses. It is all they do. They know the business better than you or me and get paid handsomely for their research. However, a year later, the share price had fallen another 70%. By then, the analyst’s targets had fallen too. However, they were, on average, still 80% above the share price.
After another bad half-yearly result in August 2021, the target was reduced so it was “only” 30% above share price.
In the space of a year, the share price had been decimated. Investors had lost nearly three-quarters of their capital. All the way down, the analysts adjusted their targets down as well, but it was always above the share price. That is, Appen was always cheap and was therefore always a buying opportunity. Below is a chart of Appen.
Appen (APN)
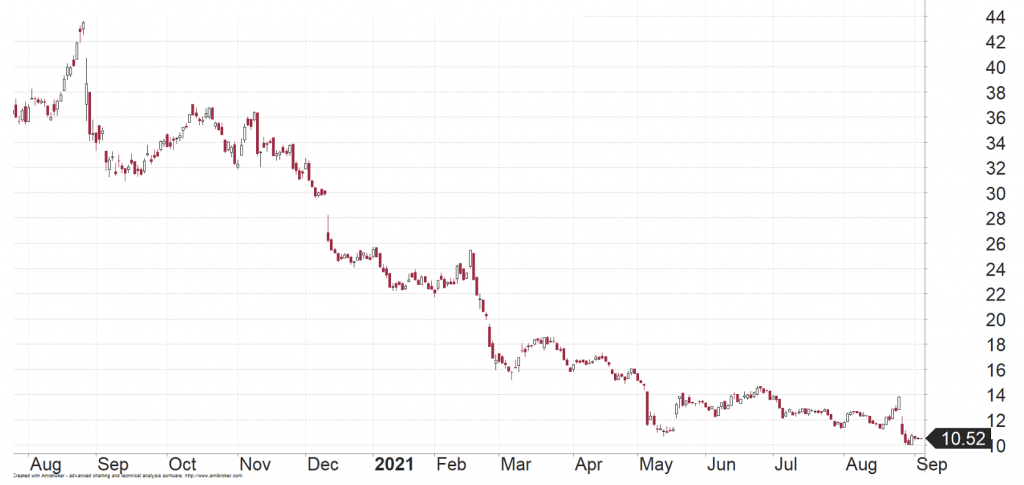
If the experts on the business get it wrong in such a spectacular fashion, then what chance does the average person have? We all get some wrong. It is inevitable. But we have to accept this and stop the bleeding at some point so it doesn’t hurt the rest of our portfolio. This is why risk management is important. It is why the average investor can benefit from having a strategy in selling stocks that goes beyond waiting for an analyst to tell them that the “fundamentals” have changed. By the time something has changed and the average person on the street becomes aware of it, the stock price has already been destroyed.
One of the first strategies in knowing when to sell is to watch how stocks react on news.
We have all seen stocks seemingly report a “good” earnings result, only for the share price to drop. And we have all thought to ourselves: “why is the market so dumb, didn’t they read the result?”.
Sometimes the initial reaction can be incorrect but give it a few days and you will then know what the market is thinking. If a share price cannot rally on good news, and it does the opposite, then you know there is a problem. In my opinion, this is a classic sell signal. You may have been too shell-shocked to sell Appen when it dropped 20% in one day. But if all the analysts release their reports in the next few days saying how wonderful the business is and are encouraging their clients to buy it, but the share price cannot recover, then that is a massive “tell” on what is really going to happen.
The lesson here is, if the share price is not doing what it “should” be doing, then there is a problem. This is especially true when the rest of the market is doing just fine. As I wrote about in Part 1, understanding money flow is very important. If the stock cannot rally on good news, then it is only going to go backwards. This is therefore a sell signal in my opinion.
More often than not, a stock will provide a sell signal when there is no news because the money flow is looking ahead and starting to reposition accordingly.
There are generally two other methods that I use when identifying whether it is time to sell.
The first method is the trailing stop method. This is where you let a stock run for as long as possible and then only sell it once it has fallen beyond a certain amount.
The other method is to sell when the momentum starts to turn after a strong move. However, the simplest method to use is the trailing stop. As I mentioned earlier, we are all familiar with the expression “hang onto your winners, sell your losers”.
Most investors are unable to do this, but using the trailing stop method will allow you to.
As I described in Part 1, we only want to hold stocks that are in an uptrend. When this uptrend is over, it is time to sell. We are not concerned if the uptrend lasts 10 days or 10 years. We also don’t care if a stock is cheap or expensive. If it is going up, it is making you money. When it is going down, you are losing money.
But how do we know when the uptrend is over? The simplest way is to cut your position once the share price falls under a particular level. This can either be a nearby support level or a moving average line. If a share price is trending higher over time, then this exit level will move up over time as well. That is, it is trailing behind the share price. It doesn’t get you out early. It will only get you out once the share price has shown that it is not going up anymore.
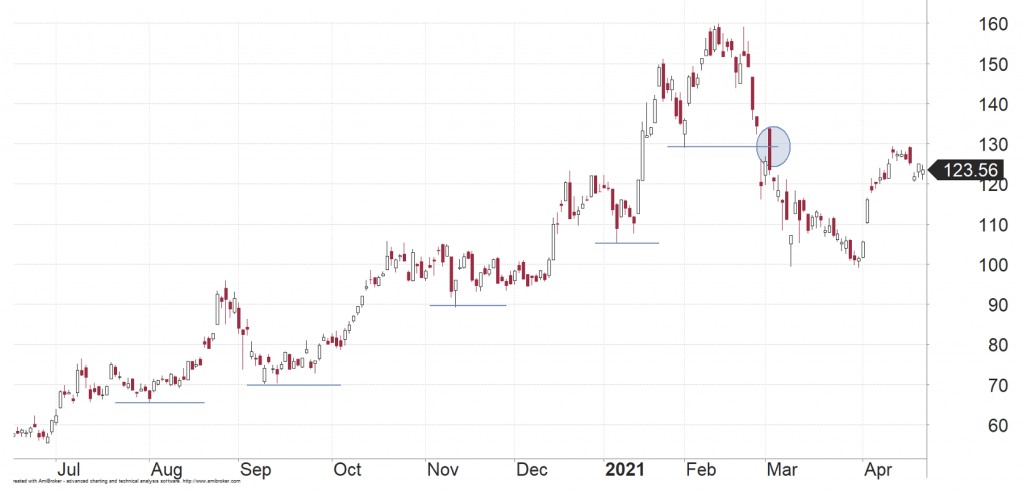
The easiest way to find a support level is to look for the prior low on a chart. As a stock trends higher, it makes peaks and troughs. The previous trough is your support level. A break under that is your signal. The chart below is that of Afterpay. The horizontal lines show the lows, and then circled is the sell signal. You miss the exact top, but you would have sold Afterpay at levels well above when most anlaysts were saying it was too expensive.
Afterpay (APT)
The other method to use is to overlay your chart with a moving average. We can try to finesse it by using more than one moving average and change the type of moving average based on the stock volatility profile. But I recommend you start with one and see how it works for you. Here is the same chart again but with a 100-day moving average.
Afterpay (APT)
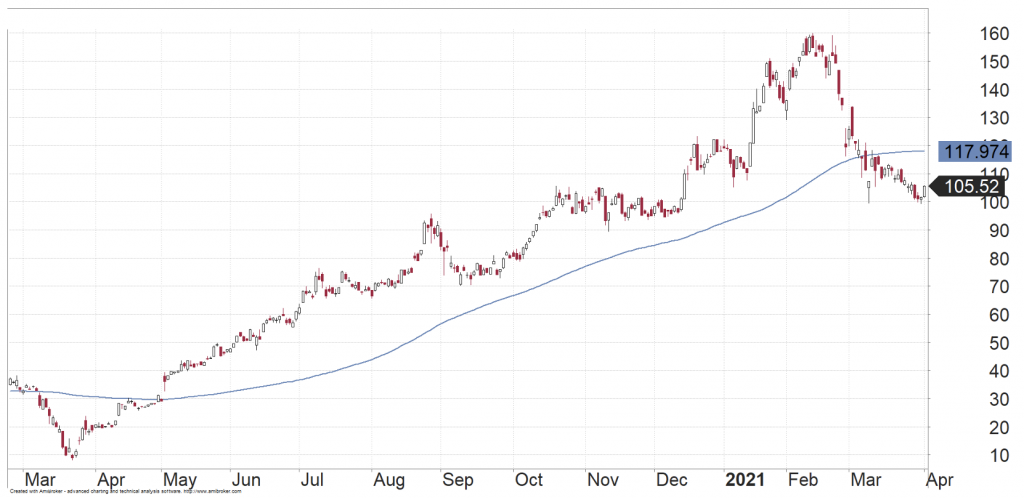
Quite simply, if the share price is above the line, it is in an uptrend. When it falls below, it is a downtrend and should therefore be sold. Many investors do very well with simple techniques like this. However, the trick of course is to be consistent and disciplined.
Having some rules like this is one way to help those who are time-poor and/or not professional investors manage downside risk. However, not all professionals are good at selling either.
If you wish to go down the path of seeking professional help, the first question I would ask of an adviser is not what to be buying, but what is the strategy when it comes to selling. These are the top 3 questions you need to ask:
Our weekly research at Fairmont Equities has some great buying ideas, and you can get a free trial, but have look at our website and see if you qualify for a free portfolio review or to access my advice directly.