29 April 2024
1300 794 893


For over a decade, I have provided advice on when to buy and sell Australian shares. Not only have I been advising investors personally, but I have also spent over 10 years giving tips and recommendations via TV, newspapers, and seminars across the country.
I have met many people and heard many stories about investing in Australian shares. Some are good, and others not so much. Most investors hope to achieve a return on their investment in order to fund a comfortable lifestyle in retirement, but many fall short. Everyone’s situation is unique, but generally, we are talking about people who are quite intelligent, who are not greedy, but for one reason or another, they just can’t achieve the consistency and returns that they had hoped for.
This has been especially true in the last several years as markets became more difficult and traditional blue-chip stocks have struggled. The major problem I see is not that there is a lack of information. Nowadays there is actually too much information and this means that there is too much noise. Finding a good business is straightforward. What to buy is often not the problem. The main problem that I see is that investors find it hard to know when to buy. And then they find it hard to know when to sell.
In this article, I will help you understand when it is the right time to buy. In Part 2, I will go through ways to identify when it is time to sell.
I will start off with a story. A client of mine, John, had been managing his own affairs for a while. He originally had a portfolio that was put together by a financial planner. Then the GFC came along. Despite his intuition that he should do something to protect his retirement savings, he received advice to the contrary. Naturally, he lost quite a bit of capital. However, to make matters worse, not all his stocks had recovered.
After feeling like he had wasted a few years and only had losses to show for it, he decided to take on the portfolio himself. He did alright for a while and picked some good stocks along the way. However, a couple of businesses, which seemed very well regarded by some analysts he was following, just lost so much money that it undid all of his good work. He felt like he was buying at the wrong time. And although he knew he had to cut these businesses at some point, he felt that unless he knew there was something fundamentally wrong, he couldn’t do it. This meant that by the time he realised there was a problem, he had already seen his stock investment halve in value. By then he felt it just wasn’t worth selling anymore. When he decided he was running out of time to turn things around and came to talk to me, it was a story that I had heard many times before.
John was predominantly focused on dividends. The whole point of investing is to generate a return on your capital. When you buy assets, such as shares or property, the expectation is that at some point in the future, the value of the asset along with any income generated over time will be worth more than when you started. When most people invest in shares, they analyse the fundamentals of a business, plug in a few assumptions, and hope that the share price is higher over time.
The fact is, unless the share price and dividends add up to an amount higher than where we first bought the shares, we cannot make a positive return. If a company’s share price is falling more than the amount of dividends paid out, then you are only going backwards. Whether your aim is for growth, income, or both, it is incredibly important that your share prices don’t go backwards.
There were a few stocks in John’s portfolio which he told me were “bottom drawer” stocks. They were companies that he bought on the cheap and figured that because he was a patient man if he just left them there for the long term, they will produce a handy profit.
When analysing a company’s fundamentals, it is important to ensure that the business is growing its earnings. Earnings growth should lead to increasing share prices and dividends. Trying to buy a stock purely because it looks cheap is a mistake that I see many investors make. A company is often cheap because of its earnings, or lack thereof. If the earnings are low or unreliable, then there is less demand for the stock by the market. If we simply look at a P/E ratio, and the earnings which is the “E” drops further, then suddenly the stock will end up expensive and the share price will need to drop further.
Conversely, an “expensive” company that is growing its earnings will see the “E” increase over time. An increase in the E part of the equation suddenly makes the stock price cheaper, which means it will rise over time. Buying a cheap company often leads an investor down a rabbit hole where a falling share price justifies further purchases of the stock based on the premise that it is getting cheaper and cheaper. Looking at a share price chart, this results in a stock that is in a downtrend. It results in an investment that is going backwards, not forwards. And the whole point of investing is to have your capital increase over time, not decrease.
When I mentioned all this to John, he understood where I was coming from. However, surely if the underlying business is still sound, why shouldn’t he just keep it? Businesses have their ups and downs but wouldn’t the market eventually wake up to the fact that these cheap companies are not going broke and their share prices will go up again?
This is true, but only to an extent. I believe that analysing a company’s fundamentals is only part of the method in finding a good investment. If it was only about analysing balance sheets, then all the wealthiest stock investors would be accountants. We need to remember that something is only worth as much as what someone else is willing to pay for it. Anyone who has ever sold a car for less than what they really wanted will understand that opinions count for nothing. You can only receive what someone else is happy to pay.
This means that you can do all the fundamental analysis in the world, but if the rest of the market isn’t buying your stock, then the share price will not go up and your capital won’t increase. This is why it is important to also understand the demand for your investment. We need to understand the money flow. If there is demand out there, and money flows into your stock, then the share price will go up. This means that you end up with a positive return on capital. Of course, it works both ways. If there is a lack of demand for a stock, and the money flow is moving elsewhere, then the share price will be unable to stay supported and it will head lower.
A big mistake that investors make is that they believe that the market has got it wrong and that they are correct. But if the market doesn’t agree with your point of view, then you won’t make money. Like it or not, we need the market to be on the same side as our point of view. Hoping that the market eventually realises that they are wrong is a risky proposition. Extending your time horizon further and further into the future and saying that you are a long-term investor doesn’t eliminate that risk.
It can sound very virtuous to say that you are part of a rare breed of people who are patient enough to wait for the share price to recover. However, the ASX is full of blue-chip companies that have still not recovered since the GFC all those years ago. How long is long-term? How long have you got – assuming that one day in the future they do recover? In some respects, Warren Buffet has done the investment community a disservice. Because he has been so successful over time, his quotes have been repeated countless times the world over.
Quotes such as “be greedy when others are fearful” causes some investors to buy bad stocks in a downtrend. Other quotes such as “the stock market is designed to transfer money from the active to the patient” causes some investors to hold onto losers for a lot longer than they should. How long must one be patient before realising that they might have it wrong? One year? Ten years? The average investor is not Warren Buffett. There is a little more nuance to these one-liners. Being patient with the wrong company doesn’t make you Warren Buffett. I become extremely wary of anyone (especially other “professionals”) who suddenly rolls out a Warren Buffett quote to explain a bad investment. We need to realise that when investments are not working, they need to be relinquished – the earlier the better.
This then leads to the obvious question of “how do we know when the market is coming our way?” John wanted to know how we can see if the market is likely on our side or not. How can I tell if we have this tailwind behind us? Technical analysis is how we can see what the market is doing. It helps us understand the emotions of the participants and the flow of money.
Starting off, it is essential to understand that there are four phases of a stock’s cycle. They are accumulation, the uptrend, distribution, and the downtrend. It looked like John’s mistakes involved buying stocks that were in the downtrend or the distribution phase. But more on that later.
As I’ve tried to explain to John and my other clients, you make money when stock prices are going up. This means that you want to be holding a stock when it is in an uptrend. It can be difficult for many investors to distinguish between the accumulation and distribution phases, so it is best to avoid those. Accumulation is a long sideways market where generally the weak sellers are finally giving up, and the smart money is taking it off their hands. Distribution is the opposite; where the smart money is finally exiting after an uptrend and those who are late to the party are finally jumping on board. And of course, it goes without saying that downtrends are best avoided altogether.
In an uptrend, each peak and trough in the share price is higher than the preceding one. In an uptrend, I also like to observe the timing of the moves and the volume to get a feel for how strong the trend is. When it comes to the timing of moves, I like to see that the time taken to cover a certain amount of ground in a rally is less than the time taken for a stock to retrace the same amount during a pullback. For example, if a stock tends to move up about $1 in a few days, but then it takes it a few weeks to fall only 50c, then logically it is telling us that the bulls are in control and the selling pressure is weak. The rallies will often be done on high volume and the declines will be done on lower volume. This difference in volume is also an indication that there is strong buying pressure.
Another great indicator of whether a stock will perform well or not is how it trades in relation to its peers. Most investors try to find the cheapest stock in a sector or the one whose share price appears to be the lowest. This is often a mistake and the hope for “mean reversion” does not eventuate.
This is a mistake that John made on a couple of his stocks. I explained that there is often a fundamental reason why one business is doing better than the other. The best companies always appear more expensive, but they are the ones that tend to do well in the long run. A great opportunity to determine whether a stock is showing strength relative to its peers is when the share market overall has a correction. Every year or so the share market takes a dive, and most stocks go down with it. Often during these periods of declining share prices, some stocks will level out early on and might even start to edge higher whilst the market is in its final days of being sold off. When I see something like that happen, it grabs my attention. When the market eventually bounces, it can be tempting for many investors to grab what appears to be the most heavily sold stock, and this is what John did a few years ago at the end of 2018.
However, you are often better off in grabbing the stock that had bottomed out before the market low. This is because rising against a falling market is potentially a sign of big institutional buying. It is telling us that this is the stock with the strongest support and what you find is that it is the stock that provides the best returns during the next uptrend phase of the market. This is a classic example of following the money flow. When you have the money flow on your side, not only do you have the chance of the best returns, but you also reduce your investment risk – which is a win-win.
As I explained to John, once you have identified the business that you want to buy, it is important to pick it up at the right time. In an uptrend, a share price will swing higher and lower while all the time making upward progress. Many investors would like to buy it on the downswing, to get it cheaper. But how do we know that the downswing isn’t the start of a downtrend? All downtrends start with a down day. So it is best to look for a stock that has already had its downwards movement but is just starting to tick higher again.
How do we know though if a downwards movement is a safe one or a dangerous one? That is, how do we know that a stock heading backwards is just having a bit of heat come out of the share price, or the backwards move is the start of something dangerous? There are a range of charting patterns that indicate to us that a stock is just taking a breather within an uptrend. Therefore, when the shares “leave” this pattern, we can be confident that they are ready to head higher again, providing a good entry point.
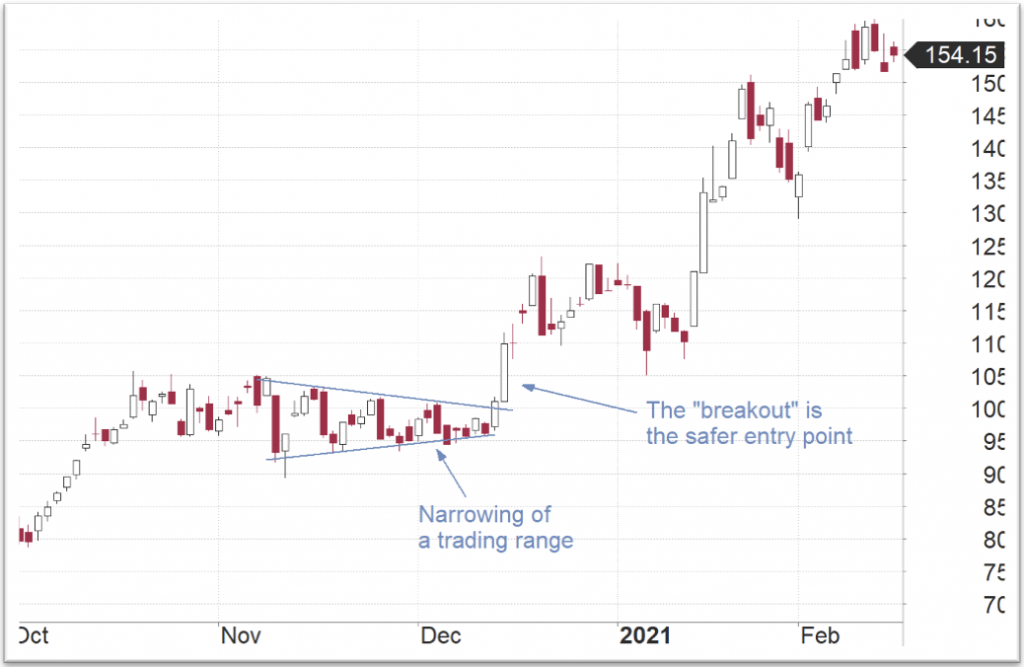
There are plenty of set-ups out there which I use in finding a good entry point. However, when I start with a new client like John, I try to show him that the best ones display the same characteristics. Generally, what you are looking for is a share price that has seen a decrease in its daily ranges and volatility. If you convert your share price chart to a candlestick of bar chart, you can see this a lot clearer (I recommend doing a Google search for “candlestick charting” and start understanding what it is and the basic set-ups).
We want to find a share price that has been heading higher quite swiftly, and then enters a period where it doesn’t seem to move much and volumes are low. Once a bit of heat has come out of the share price, it means it is readying itself for the next move. Then when we see a stock stage a “breakout” from this restful state, we then have the start of the next rally. Often this is the best time to buy a stock. Here are some common set-ups:
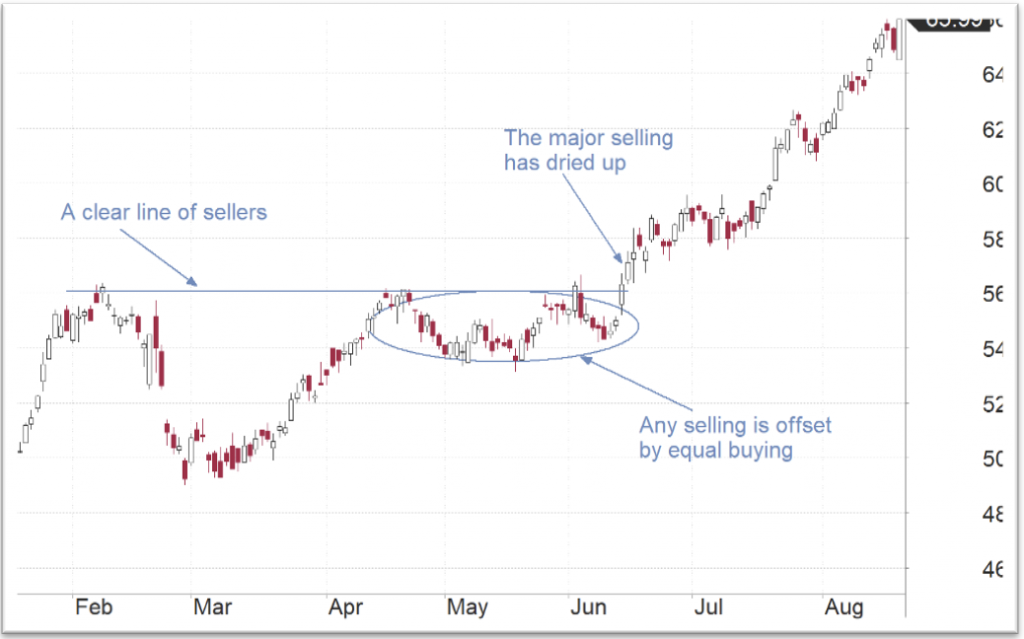
These are just a few of the many set-ups out there. Apart from charting set-ups, it is also crucial to look at candlestick patterns, volumes, and moving averages, to name a few. Once again, these technical signals should be used in conjunction with fundamental analysis to make sure that we are focusing on the best companies.
In Part 2, I will go through some useful methods to help understand when it is time to sell a stock.