

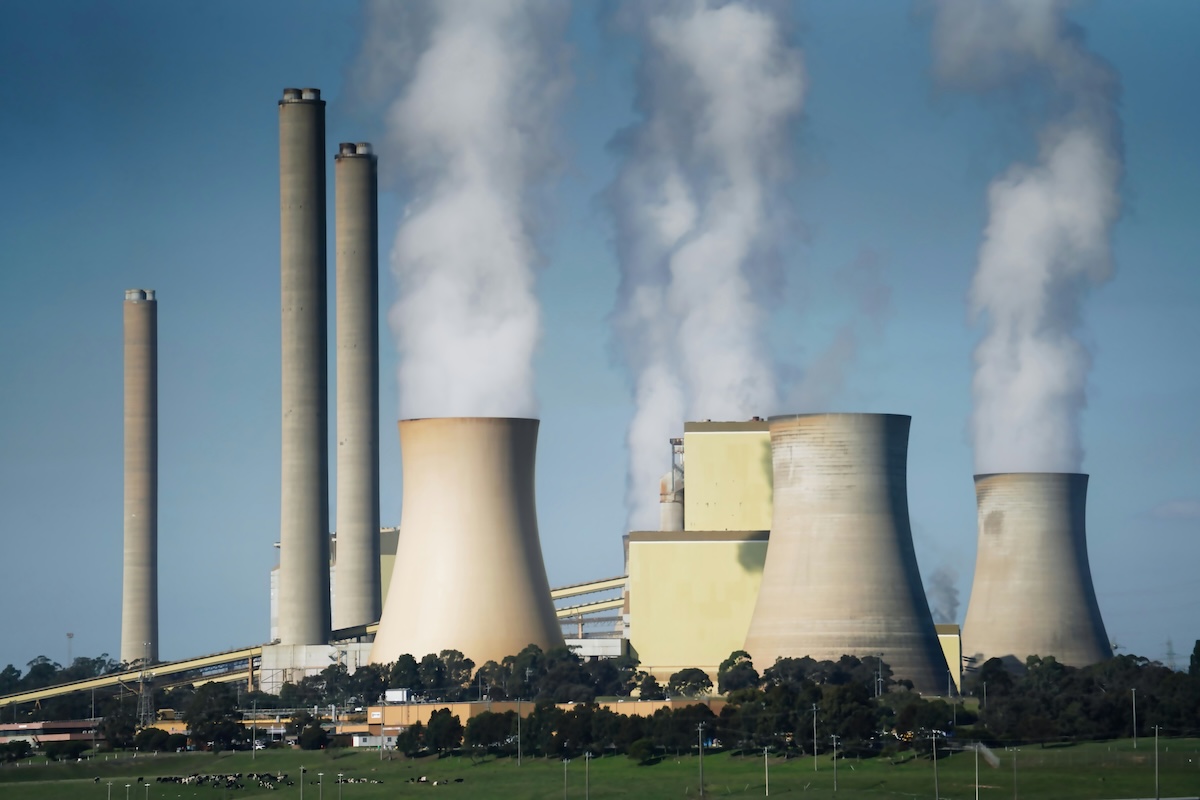
China’s latest national accounts show the economy grew by about 5% through 2025 and into the first quarter of 2026, pointing to resilience despite ongoing trade tensions.
But the underlying picture is weaker: growth slowed last year and, while it has stabilised, it remains below pre-COVID levels.
China used to regularly report GDP growth rates above 10% before 2010 and around 6-8% after 2010. So, what’s behind the slowdown from those growth rates?
Weak consumption, uncertain exports
Household spending growth remains modest, while exports are growing more slowly amid global uncertainty and the Iran war.
Together, these trends point to softer growth, weak domestic demand and more fragile external support.
China has long been seen as an economy needing to shift from heavy reliance on exports and investment spending towards stronger domestic demand.
To understand whether this shift is actually happening and whether these recent patterns are temporary, or part of a deeper shift, we examined what has been driving China’s growth over the past decade or so. Our results do not suggest that consumer spending has yet become a stronger supporter of China’s growth.
A shift in the drivers of growth
In a recent paper, we compare the sources of growth across two periods: 2012–2017 and 2017–2022.
From 2012 to 2017, China’s growth was relatively strong, with real gross domestic product (GDP) rising by more than 40%, supported by solid consumption, robust investment and steady trade expansion.
Between 2017 and 2022, however, the picture weakened: GDP grew by about 30% – one quarter less than in the earlier period. While the pandemic played a role, trade tensions and deeper structural changes were also important, with slower import growth, weaker domestic demand, and a smaller contribution from exports.
At the same time, demographic trends turned less favourable, with slower population growth, fewer working-age people, and falling labour force participation and employment rates, all of which added further downward pressure on growth.
What has caused this change?
The charts above show a clear shift in China’s growth pattern after 2017. To understand why, we used an economy-wide model to identify the main drivers of growth in each period.
In both periods, productivity was the biggest contributor to China’s growth. But before 2017, foreign demand, a shift towards domestic sourcing and stronger business investment all supported growth. Together, these factors generated relatively balanced expansion.
After 2017, the picture became less favourable. The contribution from foreign demand fell, although it remained positive. The contribution from domestic consumption growth also turned slightly negative.
China’s workforce is shrinking as the population ages, and this demographic shift has become a more significant drag, reducing growth by 3.8 percentage points after 2017.
With demographic pressures intensifying and both household consumption and foreign demand weakening markedly, China’s growth has become increasingly reliant on productivity improvements.
A shrinking population and slowing productivity
This helps explain the slowdown in growth in recent Chinese data. Demographic change is a larger drag, and productivity growth has slowed.
Looking ahead, demographic pressures are set to intensify. China’s population began to decline in 2022, and the pace of decline is expected to accelerate. The working-age population is shrinking even faster than the total population.
Population projections suggest China’s working-age population could fall to less than one-third of its 2014 peak by the end of the century.
Other traditional supports for growth also look weaker. Total public and private investment growth has weakened in recent years, with fixed-asset investment turning negative in 2025.
At the same time, slowing global demand amid heightened geopolitical uncertainty is proving challenging for exports. Trade patterns are also shifting as higher US tariffs on Chinese goods have encouraged diversification to other markets.
What this means for the future
Our central finding is straightforward. China’s growth is now being increasingly shaped by two forces: slower productivity growth and a drag from demographic change.
This is not to say the demand side of the economy does not matter. But in our analysis, changes in consumer demand, investment and trade make only limited direct contributions to GDP growth. Their significance lies more in what they reveal about the broader structure of the Chinese economy.
In particular, both the 2017-2022 period and recent data show little evidence of a shift towards consumer spending playing a larger role in supporting growth.
What this means for the rest of the world
Looking ahead, the main question is whether productivity growth can remain strong enough to offset the effects of a shrinking workforce.
Our results suggest some caution on that front. The scope for continued rapid growth by adopting and adapting existing technologies from more advanced economies is narrowing. Population ageing is likely to place continuing downward pressure on the supply of workers. Although China is investing heavily in automation and robotics, these advances may not be sufficient to fully offset these headwinds.
The international implications are harder to predict. Slower growth in China would weaken demand for goods and services that are exported from countries like Australia.
But it could also create new opportunities for other developing economies. This is already evident in the shift of some manufacturing investment to Southeast Asia, partly in response to rising costs and trade tensions.
The effects are therefore likely to differ across countries and industries. What is clear is that the character of China’s growth is changing, and that change will matter well beyond China itself.![]()
Xiujian Peng, Senior Research Fellow, Centre of Policy Studies, Victoria University and James Giesecke, Professor, Centre of Policy Studies and the Impact Project, Victoria University
This article is republished from The Conversation under a Creative Commons license. Read the original article.


I am severely impacted by the changes to CGT but I do not fit the Winner/Loser categories that gets all the news headlines.
A brief summary of “where am I now”? (Age 77; working life 47years;Bach Bus; facing redundancy in the early 1990’s I changed my focus to building my private Investment Portfolio to Match My Superannuation Portfolio.
So what did that involve 1. A small share portfolio (mainly buy/reinvest/hold strategy); I owned my own Unit, so purchased two investment properties. Sold one and Paid CGT of $23K, Purchased a new house and renovated it + used my Unit as an investment property (bought before GST – therefore no GST); Salary sacrificed all my salary into my Super for 3-5 years.
I retired at 64, my goal achieved: Self Funded Retiree; part Super Pension and balance Investment Portfolio. My income is low enough to obtain a Self Funded Retiree Health Card and a few Age Care Benefits. Although my Net Worth has doubled in the past few years (due to increasing property valuations) – Unit purchased 1981 $35K now valued $.75M + house purchased 1998 $76K now valued at $.75M + Primary Residence purchased 2002 $2.6K now valued at $1.4M.
As I have no dependents, I donate monthly to a number of charities (funded by Dividends) and plan to leave approx 50% of my Net Worth to these charities on my death.
I believed I had reached a good time in my life when all my long held goals had been achieved and all I needed to do was to meet the expenditure on maintaining my assets.
Now there is another story: My target tenant is a long term, working family. I keep my repairs up to scratch and maintain my rental increases to a minimum. BUT after doing a total renovation on the Rental House (cost $25K), I have been dudded by three of these tenants and have been barely breaking even given the added repairs and maintanence). So after all this, I thought I will get it ready for sale & pay the CGT WITH 50% discount (by the way I was under the impression that you could calculate using the 50% discount OR the indexed valuation methodology – has that changed? AND THEN ALONG CAME THE BUDGET and all my long held plans for managing my investments have been TORPEDOED.
AND I also worked out that if I sold any of my properties, the CGT would increase my Taxable Income to over the Threashold and I would loss my Seniors Health Card & my limited Age Care Support allocations.
So I have been trying to find ANYONE that has covered the MIDDLE RUN, SLOW BURN, SELF FUNDED RETIREES with the actual impact they are likely to SUFFER under this current debarkle. In you article you mentioned the average retiree has $300K in super, well mine is much higher and in fact I am forced to draw down Pension at a higher rate than I need.
I realise I sound like a squeaky wheel, but really I have not enough information to make an informed decision and most Advisors I have used in the past have had limited interest or understanding of the blended portfolio like mine.
SO THIS SQUEAKY WHEEL IS PLEADING FOR SOMEONE TO REVIEW THE IMPLICATIONS OF SELF FUNDED RETIREES who appear to be loaded into the no mans land of the 1% of wealthy Australians. We lived the dream, worked hard, saved hard and just when we should be applauded for being a Self Funded Retiree, we find ourselves as the WEALTHY BOOMERS – give me a break. I’m nearly 80 and work hard, lived simply, paid my due and taxes for years and NOW this incompitant government is conspiring to take money from the average JoBlow 40-50 year worker to give to the Greedy 10-20 year work (one can only assume they will get the benefit of their Parents Golden Egg eventually BUT not from this greed is good, shit of a Government)
Sorry if I have wasted my life, trying to speak on behalf of the miriads of SF Retirees who have been shafted well and truly by this “Reformist” or more likely “Rubbish” Government.
Kind Regards
Jean Hume.