Trump wants a tariff on movies: how would that even work, and should Australia be worried?

US President Donald Trump’s recent announcement of a plan to impose a 100% tariff on movies “produced in foreign lands” could have a massive impact on the global entertainment industry.

Film and television production is increasingly part of an interconnected global system. Hollywood’s major studios and global streaming giants use a diverse range of locations around the world, sometimes working across multiple countries for a single project.

Doing so allows them to leverage production incentives and tax shelters offered by different countries, take advantage of exchange rates to lower their production costs, and more.

They also film offshore, for example in China, as strategic co-productions and feature iconic locations and local actors to appeal to audiences in that specific national market.

Many countries have become important hubs in this global system of production. Australia is a significant player. So, how exactly might Trump’s tariffs work? And why is so much Hollywood film made internationally in the first place?

‘Movies made in America’

Trump made the announcement in a post on the social media network Truth Social. But his original statement is vague and lacks crucial detail.

Based on his post, this proposal could include any foreign movie imported into the United States. More likely, though, it refers to US movies filmed (in part or wholly) overseas.

Trump’s statement only singles out movies. He doesn’t mention television series for broadcasters, or specifically film and television programs made for streaming platforms.

This suggests a focus on movies made by Hollywood studios. It may or may not include content made by streamers such as Netflix.

Tariffs on tickets?

Movies are a kind of intellectual property. They’re intangible products or services, not physical goods. If a tariff was applied to movies, they’d become the first service in the current trade war to receive one.

So what tariffs or regulations could be applied?

One option would be a levy on distributors releasing US movies made overseas. Another option would be to adapt the French TSA model, which levies a tax on all cinema tickets. In France, this money is reinvested into the local industry. The US could impose such a tax on tickets for films with production components overseas.

Both options would pass the costs on to consumers. A drop in already fragile cinema attendance or revenues could simply cause studios to reduce the number of movies made for theatrical release.

Studios might instead concentrate on making movies and television series for their own streaming platforms, such as Disney+ and Paramount+.

Taxing production

Could the tax be imposed in other ways? Many US studio movies, and television programs, are at least partly, if not wholly, filmed internationally. But they are still US-controlled movies and still dominate the box office in many countries worldwide.

Could the revenue of Godzilla x Kong: The New Empire (2024), filmed on the Gold Coast in Australia, specifically be targeted and taxed for being made overseas, in contrast to a Hollywood movie made completely at home?

Would there be a sliding scale based on how much of a film is shot overseas? Would the tax apply to post-production or only production? The process of reviewing and enforcing this would be complex.

Another option may be taxing the portion of a movie’s production budget obtained from foreign tax incentives.

Major blockbusters filming in Australia are eligible for tax rebates and incentives, which can equate to almost half, or more, of the money they spend in Australia. But exactly how the US would review and regulate such a tax is again unclear.

Australia’s film industry

International film and television production expenditure in Australia now averages A$880 million each year. International movies alone account for about half of that figure.

And the number of movies and television series being filmed in Australia has increased dramatically since the outbreak of COVID.

Production expenditure here on both local and international productions jumped from just over $1 billion in 2019–20 to about $2.4 billion in 2022–23.

There are numerous reasons for this. Australia became a more popular international production hub after serving as a “production bubble” during the pandemic, as restrictions forced filming to shut down in many other countries. Relationships were forged between local producers, crews, film agencies and studios.

The reputation of places like the Gold Coast, known for talented crews and stunning filming locations, has also played an important role in continually luring studios back.

The biggest draw card

But the major reason is the strong pull of Australia’s tax incentives for filming content here.

In Australia, international film and television programs are eligible for a 30% “location offset” on eligible production expenditures. If a project qualifies, producers will receive a provisional certificate, and they can claim a fixed 30% rebate for expenses in an income tax return for the relevant year.

There’s also a 30% offset on eligible post-production and visual effects work. And these incentives can be “stacked” on top of an extra 10–15% in incentives from state screen agencies (such as Screen QLD).

Some combined federal and state-based production offsets amount to rebates of 50%, or more, of a project’s production spend in Australia.

Why Australia is worried

International productions, which are quite different to local film and television programs, generate employment for many local actors and technical professionals. The loss of this film production would dramatically reduce employment for local professionals.

If these levies are imposed only on movies that screen theatrically, then television series and streaming films and series could continue to film in Australia unaffected. That would lessen the impact on local industries. If the definition includes both, the impact could be dramatic.The Conversation

Mark David Ryan, Professor, Film, Screen, Animation, Queensland University of Technology

This article is republished from The Conversation under a Creative Commons license. Read the original article.

Albanese pushing ahead with super tax but could face problems

The re-election of the Albanese government has led to renewed concern about planned changes to the taxation of investment returns in superannuation funds.

Labor’s emphatic victory on Saturday night, including what looks like an increased presence in the Senate, suggests the legislation is likely to become law in the near future.

Retirement income in Australia

Australia’s retirement income system comprises two pillars: a government-funded age pension as well as private superannuation.

Super includes compulsory employer-funded contributions as well as additional personal contributions.

These two pillars are complementary; a person can receive a pension even if they have private super. But the more super they have, the less pension they are eligible for.

About 70% of superannuation assets are held in Australian Prudential Regulation Authority (APRA)-regulated funds and 25% are held in self-managed super funds (SMSFs).

There are two types of tax – and tax concessions – on super. First, employer contributions and capped personal contributions are taxed at a concessional rate of 15%. Second, income earned by a super fund is taxed at 15% for balances in the accumulation phase (when contributions are being made). Income earned in the pension phase is tax-free.

So what does the proposed reform entail?

Starting July 1, the government proposes to increase the concessional tax rate on super account earnings in the accumulation phase from 15% to 30% for balances above A$3 million.

Those affected – about 80,000 super account holders, or 0.5% of the total – will continue to benefit from the existing 15% concessional tax rate on earnings on the first $3 million of their super balance.

They will also be able to carry forward any loss as an offset against their tax liability in future years.

Concerns with the proposed reform

Concerns have been raised this reform implies the taxation of unrealised capital gains on assets held in super accounts, such as shares or property, even if they have not been sold.

This is, indeed, a significant departure from the status quo. Both APRA-regulated funds and SMSFs are currently only required to pay capital gains tax once the asset is sold and the gain is crystallised.

The move to tax unrealised capital gains is likely to prove particularly onerous for SMSFs. The typical industry super fund has a diversified portfolio of assets of varying liquidity, including significant cash holdings. But SMSF portfolios are often dominated by a large and illiquid asset (ones that cannot be easily sold and converted into cash) such as a farm or business property.

As a result, an SMSF facing a large unrealised capital gain, say from an increase in property values, may not have sufficient cash flow to pay the associated tax bill. The SMSF trustee might be forced to prematurely sell assets to meet the fund’s tax liability.

In the United States, President Joe Biden’s 2025 budget included a similar proposal to tax unrealised capital gains for households with more than US$100 million in wealth.

Purpose of the proposed reform

In announcing this initiative, Treasurer Jim Chalmers suggested the motivation was two-fold.

First, the federal government is facing pressure on the budget bottom line and generous tax concessions for super are becoming expensive.

Second, current super tax concessions are highly regressive. This means most benefits of the concessions flow to the wealthiest households which, in any case, will not be eligible for the pension.

The cost of current super concessions to the federal budget is about $50 billion in foregone revenue, according to Treasury. That is almost the cost of the age pension.

The Grattan Institute argues superannuation has become a “taxpayer-funded inheritance scheme”. A Treasury review found most Australians die with large outstanding super balances.

The Association of Superannuation Funds of Australia Retirement Standard calculates that, for a comfortable retirement, a couple needs a super balance of about $700,000 if they retire at age 67. The $3 million threshold is out of the ballpark. However, if the threshold is not indexed more people will be affected over time.

So, is this reform useful?

According to the government’s Retirement Income Review, the objective of Australia’s super system should be to “deliver adequate standards of living in retirement in an equitable, sustainable and cohesive way”.

While the proposed tax change aims to improve the equity and sustainability of Australia’s super system, it is not clear how it will work in practice.

In response to SMSF concerns about the difficulty in paying tax bills, the government’s proposal gives taxpayers 84 days to pay the tax liability instead of the usual 21 days. This hardly mitigates the risk that SMSF trustees may have to liquidate the main asset in their fund.

The Biden proposal had presented an alternative model, allowing for the tax liability to be paid over several years, not all at once. Alternatively, taxpayers could pay an interest-like charge while deferring their unrealised capital gains tax liability.

Such alternatives do not appear to have been seriously considered in the Australian government’s proposal.

Ultimately, though, the question must be asked: is taxing volatile unrealised capital gains really the most effective way to improve equity in, and the sustainability of, the superannuation system?The Conversation

Mark Melatos, Associate Professor of Economics, University of Sydney

This article is republished from The Conversation under a Creative Commons license. Read the original article.
(more…)

Trump announces trade deal with UK, markets breathe small sigh of relief

Everyone relax. It’s let's-make-a-deal time, as US President Donald Trump announces plans for a trade deal between the US and UK. So what do we know so far? (more…)

Is Albo about to axe the Australian luxury car tax?

Fresh off a knockout election win, Prime Minister Anthony Albanese is hard at work negotiating better deals for Australian goods overseas. According to new reporting, everything is on the table when it comes to the trade negotiations, including an axe of the notorious luxury car tax.

What is the Australian luxury car tax (LCT)?

The LCT celebrates its 25th birthday this year after being brought in by the Howard-era government way back at the turn of the century. It was revamped along the way by the Rudd government in 2008.

It’s a 33% tariff paid by Aussies on vehicles made overseas that were imported into Australia and sold for more than $80,567 (or $91,387 for so-called ‘fuel efficient vehicles’). 

In both 2000 and 2008 when the tax debuted and was refreshed, the idea was simple. Dissuade Aussies from buying BMW and Mercedes vehicles by making them more expensive to purchase and instead direct them to locally-made Holdens and Fords. Classic tariff tactics, there.

But in 2017, the last Australian-made Holden Commodore rolled out of its Victorian plant and spelled the end of locally-made vehicles, thus rendering the LCT a solution looking for a problem. However, the tax has stuck around since then, much to the chagrin of MPs and motorists everywhere.

The Federal Government seems more than happy to keep the LCT despite the death of local manufacturing. Probably because it’s actually a handsome money-maker that nets them over a billion dollars a year in revenue.

So what would tempt PM Albanese to part with over a billion dollars a year?

The road to free trade may spell the end of the luxury car tax

As the returned PM gets back to work on the business of the nation, he’s on a grand tour to drum up better deals for Aussie exporters.

This includes regular discussions with Indian Prime Minister Narendra Modi, and open discussions with the European Union. The EU has reportedly signalled that it's open to better trade deals with Australia, but wants something in return first.

A source has reported to News Limited that Albanese wouldn’t drop the LCT arbitrarily, and would want better deals for our agriculture on the continent in return. 

The benefits of lower tariffs and taxes in Australia are obvious for Europe, with the car industry revving its collective engine at the idea of challenging China's rapidly expanding fleet of electric vehicles currently taking to Aussie roads.

Improving deals for Australian agriculture isn't new for Albanese, either. Back in 2022 when he first took office, wrote in an op-ed that "there is great potential for our farmers to increase their exports of bulk commodities to a broader array of trading partners". At the time, it seemed he was talking about working to lift the export ban to China and defrosting our relationship with our neighbours. In his new term, it seems the names have changed but the goals remain the same.

It's a lofty goal to aim for, too: Australian farmers net over $6 billion a year exporting our agriculture into Europe alone, making the $1.2 billion scored via the local Luxury Car Tax seem like the coins you find in the couch by comparison. It's worth giving up for Australia's economy, too. Any increase in the output of the so-called Australian farm gate to Europe brings with it a significant revenue upside in the form of tax revenue from new jobs created and higher company profits (provided margins don't decline for exporters)

It’s a game of political wait-and-see as negotiations reportedly continue.

How I’ll vote this Saturday

I’ll go to my local polling place tomorrow and politely take every piece of “how to vote” material from party workers. These pieces of paper will be kept for my records. I’ll bring my own “how to vote” leaflet with me, made for for own purpose only. However, more importantly I plan to ask the Australian Electoral Commission to give me the actual ballot papers. I expect them to comply after a three-month wait. That waiting period is due to their need to keep all this matrerial just in case there is a legal challenge to the result for the ACT Senate contest or for the contest to elect one member to the House of Representatives for the Division of Canberra in which I am enrolled.

With the use of the actual ballot papers I intend to post my votes on my website. I have done that for the 2016, 2019 and 2022 elections for the Senate. This time I’ll do it for both my ballot papers and I now explain the reasoning for my votes.

In the case of the Senate, my vote will be exactly the same as in 2016, 2019 and 2022. It will also be exactly the same as it would have been if I had lived in a state, not in Canberra. The point is that I don’t feel strongly about any of the candidates, but I reject the ballot paper because I see it as dishonest and voter unfriendly. Contrary to the claims of its supporters, the Senate ballot paper has not been designed according to any democratic principle. It has been concocted by the machines of big political parties to confer a benefit upon themselves, that benefit being the guarantee it gives that any Senate places they win will go to the party machine’s choice of order. The ballot paper has manipulated the vote to ensure the party’s voters do their duty to the machine. For example, Senator Hollie Hughes (Liberal, NSW) will find her term expiring in July because she has been placed in the unwinnable fourth spot on the Coalition’s NSW ticket. She had hoped to be placed second and be re-elected.

My Senate vote will be deliberately informal – my way of shouting “I do not accept this dishonest ballot paper”. I’ll write on the top: “These party boxes should be scrapped.” Above the thick black line I’ll write: “This contrivance should be scrapped.” On the lower left-hand corner, I’ll draw an arrow pointing to the instructions and write this comment: “These instructions are deceitful.” Then, along the bottom I’ll write: “I refuse to be manipulated by the machines of big political parties”, signed Malcolm Mackerras.

Why do I say the instructions are deceitful? These are the facts. For the above-the-line vote a single first preference for a party is required by law to be counted as a formal vote. For the below-the-line vote six consecutive preferences between candidates are required by law to be counted as a formal vote. Therefore, polling officials tell lies when they say to voters: “You need to number at least six boxes” and “You need to number at least 12 boxes.” Most polling officials would not know that they are telling lies. The few that do simply tell me that they signed up with the AEC which imposed conditions about what they must say to the voters they meet.

The truth is that the politicians who voted for the so-called “democratic reform” implemented by the Commonwealth Electoral Amendment Act 2016 actually WANTED voters to believe that “1” only ATL votes are informal. The AEC has made its preference clear. Its duty to the politicians in that regard over-rides its duty to tell voters the truth. Some of this lying is defended by supporters of the AEC and I acknowledge that if the Electoral Commissioner did everything I want he would be breaking the law. I insist, however, that he has gone beyond what is required by the law. For example, the law does not ask polling officials to tell voters how they must vote. It merely requires polling officials to ask appropriate questions of voters to prevent multiple voting.

Since this system was implemented in 2016, I have written letters of complaint to the Electoral Commissioner about his official guide to general elections – because of his dishonesty in treating the Senate vote. The same applies to the current “Your official guide to the 2025 federal election: Saturday 3 May 2025.” It tells the usual lies and pumps out the usual misinformation and then says: “Did you know you can practise voting on the AEC website? Go to aec.gov.au/practise”. I did that and noticed the example given of a ballot paper with a single number “1” for a party ATL. The AEC then asserts: “Your vote would NOT be counted”. That is a straight out lie but is elaborated thus: “You need to number at least 6 boxes consecutively in the order of your choice above the line. Try again.”

Although I have been critical of the AEC for its handling of the 2016, 2019, 2022 and 2025 general elections, I have been just as admiring of the way it has handled by-elections. The best has been “Your official guide to the Eden-Monaro by-election including COVID-19 safety measures: Saturday 4 July 2020.” It has a special message from the then Electoral Commissioner, Tom Rogers. So, why commendation in one case and condemnation in the other? Answer: the ballot paper for the House of Representatives is honest.

To be consistent between the two houses of federal parliament, I have decided that I might just as well post my House of Representatives vote on my website when, in three months time, the AEC sends me these ballot papers for education purposes. My vote may be of interest to some. I begin by saying that I have goodwill towards Albanese and his government. Indeed, so much so that I can think of only one piece of legislation passed by the 47th Parliament which excited my opposition. I objected to the abolition of the Australian Building and Construction Commission. On that subject I have always agreed with the Liberal Party’s view and disagreed with Labor’s. However, on all current policy questions except defence I presently agree with Labor. On defence I am astonished at the reality that the Liberal Party has made so little of its superior policy. Apart from the deficiency of our defences, I think Australia is travelling in the right direction.

There are six candidates on my House of Representatives ballot paper. In order they are Isabel Mudford of the Greens, Mary-Jane Liddicoat of the party known as HEART, the independent Claire Miles, the Liberal Will Roche, Labor’s sitting member Alicia Payne and on the bottom Teresa McTaggart of the Animal Justice Party. I will give my first preference to Payne, second to Roche, third to McTaggart and fourth to Miles.

I disapprove of both the present-day Greens political party and of the anti-vaxer party known as HEART which is short for Health, Environment, Accountability, Rights and Transparency. I think of myself as voting against both of them – but I must choose in which square to place the number “5”. Otherwise my vote would be informal. I have decided to place my “5” beside Liddicoat and to leave the box for Mudford without any number. The purpose of that is to indicate there is a “savings” provision in the Commonwealth Electoral Act. If all candidates but one are numbered consecutively and one left unmarked then the vote is counted as a formal vote. Under the counting rules, therefore, my vote will be read as though I had placed the number “6” in the square beside Mudford.

Will Anthony Albanese be our PM after May 3?

The time has come for me to make my detailed predictions for Australia’s federal elections on 3 May. I can now honestly say that the result I have always predicted will occur. It has always been my view that the Albanese government would win a second term and I think now it is more obvious than ever. The time has come for some predictions of details. What has changed over the past month is the reality I now accept. It will be a majority Labor government.

A month ago, on Friday 28 March, the House of Representatives was dissolved by the Governor-General, Samantha Mostyn. On that same day News Limited papers ran their election special. The papers to which I refer are The Daily Telegraph in Sydney and its equivalents in Melbourne, Brisbane and Adelaide. They ran their election special in the expectation of the news of that day. The other News Limited paper, the broadsheet, delayed by one day. Therefore, my pendulum appeared on 28 March but the rival diagram the “tower of power” appeared in The Weekend Australian for Saturday 29 March and Sunday 30 March.

My article to accompany the pendulum was titled “Minority rule the likely outcome but it’s still looking like Albo will have more to celebrate” and it began this way: “At Christmas, Anthony Albanese will still be Prime Minister. He might lead a majority Labor government, but I think a minority one more likely.” Using a combination of my pendulum, the then opinion polls and my local knowledge I went on to predict that the Liberal Party would gain these seven seats from Labor: “Aston, Bennelong, Chisholm, Gilmore, Lyons, McEwen and Paterson.”

Since I wrote those words the campaign has gone more badly for the Liberal Party than I expected. I now think Labor will hold Gilmore, Lyons and Paterson. But I think the position is even worse for Peter Dutton because I now think that Labor could easily gain a seat from the Liberal Party. The single most likely seat for that to happen is Leichhardt in far north Queensland where the popular Liberal sitting member Warren Entsch is retiring and Labor has an unusually good candidate.

So, this is now my reasoning.

I begin with my pendulum which shows the notional state of parties as follows: Labor 78, Liberal 41, National 16, Greens four, independents in natural Liberal-National seats nine, and independents in natural Labor seats two. That adds up to 150.

The easy cases to predict are the two independents in natural Labor seats. I am wholly confident in predicting that Andrew Wilkie will hold Clark in Tasmania and Dai Le will hold Fowler in south-western Sydney. In the unlikely event that either were to lose, the seat would go to Labor, making a majority Labor government even more likely.

I think the Greens are fairly easy to predict. They will gain no seats but retain Melbourne and Griffith, Kevin Rudd’s old seat which lies on the south bank of the Brisbane River. So, I think Adam Bandt and Max Chandler-Mather are safe. However, the Greens will lose Brisbane to Labor and Ryan to the Liberal Party.

The Nationals are also easy to predict. They will hold their existing 16 seats but make no gains. The electoral division of Calare in central western New South Wales is held by Andrew Gee who is technically an independent. However, he was elected as a National so my pendulum counts his seat as National. It will be won by the National Party’s candidate, Sam Farraway. Gee is standing as an independent but I would be very surprised if he were re-elected. So, the difficult cases to predict are the two big parties, beginning with Labor.

The number of notional Labor seats is 78. That is the number it had in the outgoing House of Representatives. It lost a Victorian seat (Higgins) by abolition in the redistribution but the new Western Australian seat of Bullwinkel is notionally Labor, indeed slightly stronger for Labor than Higgins. My predicted number of Labor seats is 76 being made up of one gain from the Liberal Party (Leichhardt) offset by four losses to the  Liberal Party, Aston, Chisholm and McEwen in Victoria and Bennelong on the Sydney northside. Labor’s 76th seat, therefore, becomes its gain of Brisbane from the Greens.

The truly difficult party to predict is the Liberal Party. Anyway, it now has 41 seats, including those seats where defectors won in 2022 as Liberals, Moore (WA) and Monash (Victoria). I think it will lose one of those 41 seats and only one, Leichhardt to Labor. However, it will make four gains from Labor (named above) and one gain from the Greens, Ryan. So, my prediction is that the Liberal Party will have 45 seats, compared with 41 in the outgoing House of Representatives.

The really big problem for the Liberal Party is the likely re-election of the six incumbent teal members. Most of my friends in Sydney, Melbourne and Perth live in teal seats and they tell me of the Liberal Party’s desperation to win back the seat in which my friend is an elector. Broadly speaking that display of desperation further alienates my friend. Anyway, I predict that the six female teal incumbents will be re-elected but that the teals will make no further gains.

There is a point I should mention. I have a history of making cancelling errors. For example, back on 31 January there was posted my article “Setback looming for Victorian Labor” (Maureen, show in blue). When I wrote that article I felt the Liberal Party would gain one but not both of those seats for which by-elections were held on 8 February. As things turned out I named the wrong seat but I was correct in predicting one gain. With the federal election I think the Liberal Party will make one NSW gain, either Bennelong or Gilmore but not both. I decided on Bennelong on the ground that the Liberal candidate, Scott Yung, drew the top position on the ballot paper whereas in Gilmore the sitting Labor member Fiona Phillips drew the top position. I would not be surprised if I have again made cancelling errors. Then again I would not be surprised if Labor held both seats, nor would I be surprised if the Liberal Party gained both seats.

Finally, there is the Senate election. That is easy. In the territories the result will be identical to that in 2022, both in terms of the names of senators elected and by party distribution. In the states the result by party will, Queensland excepted, be identical to that in 2019 but some names will be different since this is a party machine appointment system. So, for example, NSW Senator Hollie Highes will be defeated because the Liberal Party has placed her in the unwinnable fourth position and her place will be taken by another Liberal, Jessica Collins, who enjoys the second position.

The exceptional case is Queensland where the LNP won three seats in 2019 with one each for Labor, Greens and Malcolm Roberts of Pauline Hanson’s One Nation Party. This time Labor will get two so the overall distribution of senators by party will increase by one for Labor with one less for the Coalition.

Is Mark Carney predicted to prevail as Canada’s PM?

Canada and Australia make for an interesting compare/contrast exercise. Their similarites begin with the fact of King Charles III being the Sovereign, even to the point of his head being on their coins. Other similarities are their high standards of living, federalism, multiculturalism, bigness in area and roughly similar patterns of exports. Their differences are that Australia is unicultural where Canada is bicultural, Australia is an island where Canada has a giant neighbour to its south and Canada is a cold country where Australia is hot. The Canadian Liberal Party is progressive while Australia’s Liberal Party is conservative.

The above being the case, it’s interesting to record that both countries will have general elections in the same week, Canada on Monday April 28 and Australia on Saturday May 3. Both Canada and Australia have parliamentary systems but at the moment their lower house is dissolved. Anthony Albanese will contest the New South Wales electoral division of Grayndler in Sydney while Mark Carney will contest the Ontario electoral district of Nepean in Ottawa. Mind you, Canadian journalists are not so pedantic as to refer to Nepean as an “electoral district”. Carney, they say, is contesting the “riding” of Nepean. These two prime ministers differ in that Albanese will win Grayndler for the ninth time while Carney will win Nepean for the first time.

Canada is both more American and more British than Australia. Its lower house is called the “House of Commons” showing its Britishness while Australia uses the general term “House of Representatives”, as do the Americans. Both countries have a Senate, but Australia’s Senate is more-or-less modelled on the American and is “unrepresentative swill” in the same kind of way. The Canadian Senate is not elected, so it is rather like the British House of Lords.

The lower house of both Canada and Australia is composed of a certain number of seats distributed between the states (provinces in Canada) according to a population formula. In both cases the principle of single member electoral divisions prevails. Seats have been redistributed recently increasing the Canadian House of Commons from 338 seats to 343, but reducing the Australian House of Reporesentatives from 151 members to 150. The total population of Canada is 41 million while Australia’s is 27.2 million. Of more interest, however, is the number of electors enrolled to vote. We’ll learn these exact numbers after the elections are over. Current estimates are that Canada will have 29 million electors and Australia 18 million. That means each Canadian riding has 85,000 electors on the roll while Australia’s electorate average number is 120,000.

Politically Canada is more British than Australia in two important ways. First, the casting and counting of votes is first-past-the-post in the United Kingdom and Canada and preferential in Australia. The second is that voting is voluntary in the UK and Canada and compulsory in Australia. Bearing these differences in mind I have decided to make more general predictions in the case of Canada and give more details about Australia in a later article for Switzer Daily.

Canada became a country in 1867 and Carney is its 24th prime minister. Australia became a country in 1901 and Albanese is its 31st prime minister. That is another way of saying we have had a remarkable number of very short-term prime ministers, being Frank Forde (1945), Earle Page (1939), John McEwen (1968), Arthur Fadden (1941) and Chris Watson (1904) each of whom served for less than 120 days. By contrast, Canada’s shortest term prime minister Kim Campbell (the only woman) served for 132 days in 1993. If the Liberal Party loses the forthcoming election then Carney would become the prime minister with the shortest term.

The Leader of the Opposition in Canada is Pierre Polievre, the leader of the Conservative Party. He has held both posts since 2022. He represents the riding of Carleton in Ontario – so both leaders come from Ontario and both note that English is their preferred language. In this they differ from former prime minister Justin Trudeau (November 2015- March 2025) who has represented the riding of Papineau in Quebec and notes his preferred language to be “French/English”. Until Donald Trump started his trade war with Canada Polievre was widely expected to win the 2025 general election.

As indicated above my prediction now inclines to the view that the Liberal Party will win again – something I would not have predicted if I had made a forecast six months ago. Trump is the man who has caused this turn-around. He is just as bad a president as I predicted when I forecast his election. See “June 27 and July 13 gave Trump the 2024 election”, posted on July 19 last year. https://switzer.com.au/the-experts/malcolm-mackerras/june-27-and-july-13-gave-trump-the-2024-election/ . As a former governor of the Bank of Canada (2008-13) and later the Bank of England (2013-20) Carney benefits from a reputaion of being a good economic manager. Polievre, meanwhile, has lost the ability he had in spades against Trudeau, namely to condemn the Liberal prime minister as being “woke”. Polievre now tries to be as anti-Trump as possible but there are doubts about the extent to which he can succeed in Trump-bashing.

The turn-around in the opinion polls caused by Trump is what has made me now inclined to predict Carney winning – but it is not the only feature of the situation that causes me so to forecast. I am aware that the electoral system favours the Liberal Party and disadvantages the Conservative Party. The explanation for this is that the Conservatives win all the seats in Saskatchwan and nearly all in Alberta and these massive wins waste away the Conservative vote. Meanwhile, the Liberal Party wins seats in the eastern provinces by smallish majorities. So, the Liberal vote is spread economically.

The most recent general election in Canada was the 44th held on 20 September 2021. The second most recent was the 43rd held on 21 October 2019. At both those elections in Saskatchewan all 14 ridings were won by Conservatives with massive majorities. In Alberta in 2019 there were 33 Conservative wins of the 34 ridings. In 2021 it was 32 out of 34. It is true that Alberta (as the most rapidly growing province in population) is to get three more seats at this 45th general election but that lessens the bias only to a very small degree.

Let me give the statistics of the 44th general election in September 2021 when 17.2 milion votes were cast. In votes the biggest party was Conservatuive with 5.75 million votes. That won it 119 seats. The second biggest party in votes was Liberal with 5.56 million votes. That gave it 159 seats, making it by far the biggest party in seats. The third biggest party in votes was the leftist New Democratic Party with 3.04 million votes and 25 seats. So, the NDP was third biggest in votes but fourth biggest in seats. The fourth biggest party in votes was the Bloc Quebecois which won 32 seats, all of them from Quebec. Likewise, all its votes came from Quebec but accounted for 1.31 million in total. All the rest combined secured 1.54 million votes and won just three seats, one each in British Columbia, Ontario and Quebec.

The alleged unfairness between parties in Canada for its House of Commons is essentially the same as the alleged unfairness between parties in the United Kingdom with its House of Commons. Consequently, in both countries there is incessant talk about proportional representation. For a variety of reasons about which a magnum opus book could be written no change is ever made.

The American electoral college bias has disappeared

Further to my Switzer Daily article of 21 January 2025: Mackerras on return of President Trump https://switzer.com.au/the-experts/malcolm-mackerras/mackerras-on-trump-202/ I note that the second presidency of Donald Trump is now clearly emerging to be just as big a disaster as the first presidency of this man. That such would be the case was predicted by me in my Switzer Daily article posted on July 19 last year: June 27 and July 13 gave Trump the 2024 election https://switzer.com.au/the-experts/malcolm-mackerras/june-27-and-july-13-gave-trump-the-2024-election/ That article included this further prediction: Mark my words. The second Trump aberration will be just as bad for America as the first.

When I get into conversation with Americans or Australians of the type I describe as “Americanists”, the question typically revolves around the American political system, and it then inevitably moves into a discussion of the electoral college method by which the President is chosen. Consequently, I think it appropriate for me to put into print my view of this system which is so peculiarly American. The President of lots of countries is popularly elected and none of them would contemplate the idea that the country in question should copy America. The reverse is always the case.

I have taught American politics at university level since 1974, and my students have been surprised to learn that I defend the electoral college system. My defence doesn’t take the form of suggesting this system should be copied by any other country. Rather, it takes the form of asserting that it accords with all the other features of American democracy.

There are four federations in the world whose politics I have taught: the USA, Germany, Canada and Australia. The way I classify them is to say that America differs from the other three in that the US is a federal federation where the other three are national federations. The conduct of elections best illustrates the point. In Germany, Canada and Australia, national elections are conducted nationally. In the US, they are conducted by the states and local governments. So, in the national federations, the same rules apply throughout. That is not the case in the USA. For example, in Maine, preferential voting applies and (mark my words) other states will follow in quick time. At present, the other states have first-past-the-post voting and counting of votes.

For example, suppose one votes for Jill Stein, the perpetual candidate for the Green Party. Outside Maine, that’s a wasted vote. By contrast, the Maine elector could vote first preference Green and second preference Democratic or Republican. In other words, Maine recognises the right of the voter to transfer her/his vote from an excluded candidate to one who is still in the count. Like Australia and Ireland do. The electoral college system merely acknowledges that such is the way America does its democracy. According to the aphorism “If it ain’t broke, don’t fix it” we can be sure that this system is permanent. I have always taken the view that if a system is clearly permanent, one might just as well defend it.

Apropos of Maine, readers may be interested to know that the rural second congressional district is naturally Republican. In 2024 it gave 212,763 votes to Donald Trump and 176,789 to Kamala Harris. However, it re-elected its Democratic member of the House of Representatives, Jared Golden. He had first won the seat in 2018 by defeating then Republican incumbent Bruce Poliquin who had led Golden on the primary vote. However, the distribution of the preferences of a third candidate gave Golden a final vote of 142,440 to 138,931 for Poliquin who was furious – as was his party. But the people of Maine had, at a referendum in 2016, voted for this system which is known in America as “ranked choice voting”.

My main argument in favour of this system takes the form of noting the results of all presidential elections in my lifetime. In 1940, 1944, 1948, 1952, 1956, 1960, 1964, 1968, 1972, 1976, 1980, 1984, 1988, 1992, 1996, 2004, 2008, 2012, 2020 and 2024 the man who won the presidency also won the popular vote. That is 20 elections. By contrast there were only two elections to “misfire” as the Americans say it. The first was in 2000 when Republican George Bush junior polled 50,455,156 votes and Democrat Al Gore polled 50,992,335. Details of the second case are given below.

The Trump propaganda machine has had remarkable success in persuading people that he has performed much better in the voting than was actually the case. By contrast, Hillary Clinton in 2016, Joe Biden in 2020 and Kamala Harris in 2024 performed far better in votes than people seem to understand. That point is best understood when people know that Biden defeated Trump in 2020 in a landslide – yet the Trump propaganda machine has persuaded a substantial minority of Americans that the 2020 election was “stolen”.

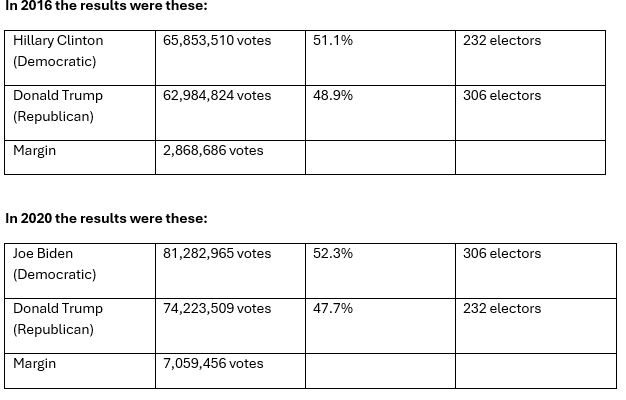
Consider these points. First, the popular vote for Biden was 81,282,965 votes and for Trump 74,223,509, a margin of 7,059,456 votes. Second, Biden won eight of the nine swing states. He lost only North Carolina but he won the other eight swing states, Arizona, Georgia, Michigan, Nevada, New Hampshire, Pennsylvania, Virginia and Wisconsin.

Here is where my argument about the electoral college comes in. After the 2016 election I became convinced (as did many other pundits) that the electoral college system was loaded against the Democratic Party. However, following 2020, my analysis told me that the bias had disappeared. But American pundits thought otherwise. They are much better mathematicians than I am, so they were able to demonstrate by using multiple regression analysis that I was wrong.

Therefore, I have decided to compare like with like by considering the two cases of narrow Trump wins against female Democratic candidates.

The first case was 2016 when the result was this:

Hillary Clinton (Democratic)                 65,853,652 votes        51.11%             232 electors

Donald Trump (Republican)                 62,985,134 votes        48.89%             306 electors

Margin                                                  2,868,518 votes

Clinton carried three swing states, Nevada, New Hampshire and Virginia. Trump carried the other six.

The second case was 2024 when the result was this:

Donald Trump (Republican)                  77,302,169 votes       50.75%            312 electors

Kamala Harris (Democratic)                 75,015,834 votes        49.25%            226 electors

Margin                                                  2,286,335 votes

Harris carried only two swing states, New Hampshire and Virginia. Trump won the rest. However, the interesting feature of the above statistics is that Harris won 226 electoral college votes, only six fewer than Clinton won in 2016. That is accounted for by the fact that the two women won the same states except Nevada which Clinton carried, and Harris lost. To me that indicates the supposed bias in the system against the Democratic Party (illustrated so dramatically in 2016) has clearly now disappeared.

I am a mere bush mathematician but my way of proving this proposition is to compare the two results in this way. First, look at my pendulum following the 2016 election. Whereas the national Clinton figure was 51.11 per cent her figure in the tipping point state of Wisconsin was 49.59 per cent. That is a difference of 1.52 per cent. Second, look at my pendulum following the 2024 election. The national figure for Harris is 49.25 per cent but her figure for the tipping point state of Pennsylvania is 49.14 per cent. That is a difference of only 0.11 per cent. The difference between the two statistics has fallen by 1.41 per cent. I take that as proof that the bias in the system has disappeared. I’ll be very interested to learn what the American statisticians conclude after they have done their sophisticated multiple regression analysis.

So, why has this occurred? I would say that Clinton wasted her vote by doing exceptionally well in these big states she won: California, New York, Illinois and New Jersey. She also polled reasonably well in Texas and Florida, but she lost those so her respectable vote was useless to her. Meanwhile, Harris still easily won California, New York, Illinois and New Jersey and lost Texas and Florida by big margins. She used her vote much more economically than Clinton had done.

So, the case for keeping the electoral college is strong and I confidently predict that in 2028 the candidate who wins the presidency also will win the popular vote.

Roger Cook a sure bet in WA

On Saturday 8 March, the Labor Party will have a good night in Perth. It will be in great contrast to the night exactly four weeks earlier on Saturday 8 February when, as I predicted in my last Switzer Daily article “Setback looming for Victorian Labor” https://switzer.com.au/the-experts/malcolm-mackerras/setback-looming-for-victorian-labor/ their night in Melbourne was characterised by weeping, wailing and the gnashing of teeth.

In Western Australia’s case, let me begin at the beginning. At the last general election, held on 13 March 2021, Labor secured 59.9% of the primary vote and 69.7% of the two-party preferred vote. In seats the result was 53 for Labor, four for the Nationals and two for the Liberal Party, Cottesloe in the metropolitan area and the rural seat of Vasse in the south-west. The Nationals won three wheatbelt seats (Central Wheatbelt, Moore and Roe) and the remote seat of North West Central. There are no Greens or independents, and the total Legislative Assembly number is 59 seats.

At the 2021 general election, both the leader and deputy leader of the Liberal Party lost their seats. So, with the Nationals becoming the bigger party in the Legislative Assembly the new Leader of the Opposition became Nationals leader Mia Davies. She has now “retired” by which I mean she will not re-contest her seat of Central Wheatbelt on 8 March. Instead, she will contest (unsuccessfully in my prediction) the new federal seat of Bullwinkel at the federal election I predict will be held on 12 April. So, the state Leader of the Opposition is now Shane Love, Nationals leader and member for Moore. On the other side of politics, Labor’s leader was Mark McGowan from 2012 to 2023. More importantly, he was the 30th Premier from March 2017 to June 2023, since which date Roger Cook has been the 31st Premier.

During the term of the 41st Parliament (2021-24), there were two by-elections, both caused by resignations. The first was in North West Central where the National Party’s Vince Catania had been the member. The by-election took place in September 2022 and was a contest between the National Party winner Ms Merome Beard, who finished with 3,071 votes, and the Liberal candidate Will Baston who finished with 2,008. The second was in McGowan’s seat of Rockingham where the contest was between the Labor winner, Magenta Marshall who finished with 13,412 votes and an independent Hayley Edwards who finished with 8,443 votes. There was a Liberal candidate who performed so poorly as to be eliminated - and his preferences distributed!

These two by-elections illustrate the nature of Western Australia’s bias in favour of rural and remote electoral districts. In North West Central the number of electors was 10,904 at the redistribution in November 2019 and 11,189 at the by-election. Its area was 820,591 square kilometres, the biggest in the state. In Rockingham the numbers were 27,975 electors at that redistribution and 30,213 at the by-election. Rockingham’s area then was 49 square kilometres. It is a typical urban seat in terms of its size and number of electors.

Another redistribution was completed in December 2023. To the surprise of no one, it saw the abolition of North West Central and a new seat created in Perth’s rapidly growing outer southern suburbs. That seat, to be known as Oakford, will be safe for Labor so the interesting question is what will happen to Merome Beard. The abolition of her seat was accompanied by the abolition of Moore, the seat held by Love. The upshot is that the two will contest the new seat of Mid-West, it being, in effect, an amalgamation of Moore and North West Central.  Love will contest as the leader of the National Party, who is technically also Leader of the Opposition. Beard will be the Liberal candidate. In other words, Beard wanted to stay with the Nationals but, when thwarted of her wish to stay in Parliament in a safe Nationals seat, she defected to the Liberal Party. Mid-West is very rural, covering the area surrounding Geraldton. Its northern-most town is Carnarvon. Its southern-most town is Dalwallinu.

The media do not treat Love as though he is Leader of the Opposition. The alternative Premier, they say, is Libby Mettam, the member for Vasse and now Liberal leader. The latest Newspoll asked voters who should be Premier with 54 per cent nominating “Roger Cook”, 34% saying “Libby Mettam” and 12% saying “Other”.

I attach hereto my new pendulum based on the new boundaries. The number of notional Labor seats now is 54 (up one) and the number of notional seats for the National Party is three (down one). The Liberal Party stays at the two seats it won in March 2021. This pendulum is posted on my website. Any reader who wants a hard copy, just write to me asking for one. I have plenty of spare copies.

My Legislative Assembly prediction is for a biggish swing against Labor, reducing it from 69.7% of the two-party preferred vote to 57.7%, a swing of 12%. On a perfectly uniform swing that would leave Labor on 43 seats, increase the Liberals to 12 seats and give the Nationals four. While the swing against Labor will not be perfectly uniform, I know from experience that the deviations of swing on my pendulum cancel out – so that is my prediction, 43, 12 and 4. Will there be any Greens or independents? I don’t think so, but it would not entirely surprise me if teal independents took Fremantle from Labor and Cottesloe from the Liberal Party.

Although most attention will be given to the election of 59 members of the Legislative Assembly, there will also be an election for 37 members of the Legislative Council, with all 96 members in the 42nd Parliament serving for four-year terms. The Legislative Council result in March 2021 was that Labor won 22 seats while the combination of all the rest was 14 members, total 36. However, that was the result under the “bad old system”. There has since been a genuine democratic reform whereby all 37 members will be elected from the state voting as one electorate under a proportional representation system. My predictions are 15 Labor, 11 Liberals, three Nationals, three Greens, two Legalise Cannabis Party and one each for the Daylight Saving Party, the Animal Justice Party and Pauline Hanson’s One Nation Party.

What politicians call “democratic electoral reform” is often seen by outsiders as being a stitch up of one kind or another - and I often find myself in the company of such cynical outsiders who say that. For example, my recent Switzer Daily article on Victoria’s democracy was posted on 30 August last year and titled “A cynical stitch up is ready to be debated” https://switzer.com.au/the-experts/malcolm-mackerras/a-cynical-stitch-up-is-ready-to-be-debated/ This WA case, however, is exceptional. For those who want to read me further on this subject I refer you to my article “WA implements a genuine democratic reform” https://switzer.com.au/the-experts/malcolm-mackerras/wa-implements-a-genuine-democratic-reform/  It was published in Switzer Daily on the morning of 24 November 2021.

Setback looming for Victorian Labor

Next Saturday, 8 February, some 80,000 formal votes will be cast in different parts of Melbourne. They will be the first Australian votes counted for 2025 and may serve as a guide to other Australian election results later in the year. The votes in question will come from by-elections for two electoral districts in Victoria’s Legislative Assembly, Prahran and Werribee. Prahran is very markedly south-eastern inner metropolitan and includes the suburbs of Prahran, South Yarra, Windsor and much of Saint Kilda. Werribee is just as markedly south-western outer metropolitan and semi-rural and is based on Wyndham City but includes Werribee and Little River and reaches on to Port Phillip Bay.

My predictions are that Prahran will be won by the Greens candidate, Angellica Di Camillo, while Werribee will be won by the Liberal candidate, Steve Murphy. Runner-up candidates, therefore, would be Rachel Westaway (Liberal) in Prahran and John Lister (Labor) in Werribee.

The way in which these by-elections came about speaks volumes to what Australian politics is like these days. Prahran had a 42-years-old male Greens member, one Samuel Hibbins, known as Sam. He resigned his seat on 23 November. Why? Because his Greens parliamentary colleagues in effect forced him to resign. He had had a brief affair with a staffer. That’s what the moralising Greens are like. A Labor, Liberal, National or independent member would not have resigned his seat for such a reason. In the case of Werribee, the member was Labor’s 65-years-old Tim Pallas who was Treasurer in the Andrews and Allan Labor governments. In the good old days, he would have retired at the expiration of his term as Werribee member in November next year. Instead, he resigned his seat on 6 January 2025 – but the media describe him as having “retired”.

A look at the history of these two seats suggests that both are marginal. Back in the days of Henry Bolte and Rupert Hamer as Liberal Premier, the member for Prahran was the great cricketer Sam Loxton (Liberal) and the member for Werribee was Neville Hudson (Liberal) but when John Cain’s Labor government was in office from April 1982 to August 1990 both went to Labor. During the Kennett years (October 1992-October 1999) the Liberal Party won back Prahran and was highly competitive in Werribee without winning it. Then Ted Baillieu was Liberal Premier from December 2010 to March 2013 and these two seats split. Prahran had a Liberal member, a certain Clement Newton-Brown, but the name “Werribee” was dropped in favour of the more metropolitan name of “Tarneit” for which Pallas was the member. However, the idea that Prahran is more Liberal than Werribee, though historically correct, has been thrown out the window by boundary changes and demographic change. The reverse is now the case.

The Labor Party is in a bad way in Victoria at the moment, so bad in fact that it has decided not even to contest Prahran which seat Labor seems to accept is now permanently in the column of the Greens. So, what about the Liberal Party? According to my current Victorian pendulum, the Liberal Party needs a swing of 12.1% to take Prahran from the Greens and a swing of an even 11% to take Werribee from Labor. Those statistics, however, are misleading in the current context. Werribee covers territory in which the Liberals now do pretty well whereas Prahran covers territory in which the Liberal Party is going backwards.

Nominations for both seats closed on Friday 24 January and the positions on the ballot paper were drawn by lot. Three interesting features were revealed. The first was the number of candidates. There will be 11 candidates for Prahran and 12 for Werribee. Those are high numbers. Bear in mind that the system is one of full preferential voting. Therefore, we may expect yet another very high informal vote of about 10% in Werribee and a higher-than-normal number of informal votes in Prahran.

The second interesting feature applies to Prahran. There is an independent candidate whose name is Tony Lupton. That name rang a bell with me, so I checked my records and found that Tony Lupton was the Labor member for Prahran from November 2002 until November 2010 when he was defeated by Clement Newton-Brown (Liberal). Lupton should get good support reflecting Labor supporters who are reluctant to switch their primary votes from Labor to Greens consequent upon Labor’s decision not to stand a candidate.

The third interesting feature is that the Liberal Party got lucky in the draws for ballot paper positions. In both seats the Liberal candidate is second. In Prahran the Liberal candidate, Rachel Westaway, is just below Nathan Chisholm (independent) while in Werribee the Liberal candidate, Steve Murphy, is just below Raheem Rifai of the Greens. The serious candidate of the left in Prahran, Angelica Di Camilla of the Greens is placed 8th while Labor’s John Lister is at number 11 in Werribee.

Finally, readers may be interested to know I am now predicting that the federal election will be held on 12 April, the last Saturday before Good Friday. In expectation of this date, I have l posted my newest pendulum on my website at www.malcolmmackerras.com. It is the first of my Australian pendulums to appear and is titled “Mackerras Pendulum Federal 2022 Result, Adjusted for Aston by-election April 2023, and for new boundaries in 2025”.

Mackerras on return of President Trump

The world is now ready for the new Trump term to begin on Monday January 20. In my opinion it is very appropriate that US flags should be flown at half-mast – even though that is a sign of respect for the late Jimmy Carter, the 39th President (1977-81) and not disrespect for Donald Trump who was the 45th President (2017-21) and will be the 47th from 2025 to 2029.
We have seen the first day of meeting of the 119th Congress on Friday January 3 – of which more below. We have also noticed that January 6 this year witnessed the peaceful transfer of power, as also occurred on January 6, 2017. As to why January 6, 2021, saw an insurrection to stop the peaceful transfer of power – that will be debated for many years, but my take is given below.
In the meanwhile, one set of statistics has been missing. So far, we have not been told the final count of the popular vote recorded for the November 2024 presidential election. I give it below, showing the equivalent votes for the 2016 and 2020 elections.


It is important that these statistics should be recorded because they enable reputable analysts to counter the propaganda of so-called “conservative” commentators (of which the most offensive have been Rowan Dean and Paul Murray) who insist that Trump won in 2024 by a landslide, even as they accept that the 2020 election was “stolen”.
Let me give the definition of “landslide” as found in my 1964 edition of The Shorter Oxford English Dictionary. In its figurative use landslide is described as “a great majority of votes, an overwhelming victory, especially in an election.”
On that basis none of the three elections contested by Trump could be described as a landslide. All the reputable analyst can say is that the biggest popular vote was given to Joe Biden in 2020. One can also note that Trump won the popular vote in 2024, but his win was smaller than that enjoyed by Hillary Clinton in 2016. A Trump admirer could also say that he won 63 million votes in 2016, 74 million in 2020 and 77 million in 2024, so his vote is on the rise.
In my Switzer Daily article posted on July 19 last year (“June 27 and July 13 gave Trump the 2024 election”) https://switzer.com.au/the-experts/malcolm-mackerras/june-27-and-july-13-gave-trump-the-2024-election/ I predicted that Trump would win the popular vote, and the opinion poll published with my pendulum on election day in the Sydney Daily Telegraph and the Melbourne Herald Sun also pointed to that outcome. Therefore, I am not surprised that Trump did win the popular vote narrowly in 2024. But note also something else I wrote in that Switzer Daily article. “Mark my words. The second Trump aberration will be just as bad for America as the first.”
What these statistics tell us is that the vagaries of the electoral college system presently favour the Republican Party. That being so those vagaries conceal the reality which is that the Democratic Party has been the natural majority party since the 1992 presidential election. For my defence of that proposition read below.
The chutzpah of Donald Trump knows no bounds, but his propaganda skills have been useful to his party. Looking at the three sets of statistics shown above it is incredible that the biggest victory (Biden in 2020) is the one described as “stolen” while Trump’s two narrow wins should be accepted as okay. In any sensible world all three would, without question, have been accepted as okay. All three results were decisive.
How, therefore, could this absurd situation have arisen? The answer I give is that since 1978 the Republican Party has been the one to play hardball. When the Democrats have responded in any way the Republicans have been able to pretend that it has been the Democrats who have played hardball. The reality is that the Republicans started this process, and I use the year 1978 because that is the year Newt Gingrich was first elected to the House of Representatives. Trump’s propaganda skills leave those of Gingrich for dead, but it was Gingrich who started this process. He was first elected to a Georgia congressional district in 1978 and was leader of the Republicans from 1995 to 1999 (and therefore Speaker) but took his throwing of bombs too far – so he became an embarrassment to the party and was displaced by a more moderate Republican.
The comments made above may well give the impression of me as a boastful man. To counter that impression, I now record that on 23 January last year my Switzer Daily article was titled “Trump will not get a second term” https://switzer.com.au/the-experts/malcolm-mackerras/trump-will-not-get-a-second-term/ My fallibility is demonstrated by my need to cancel that prediction - which I did in the July article.
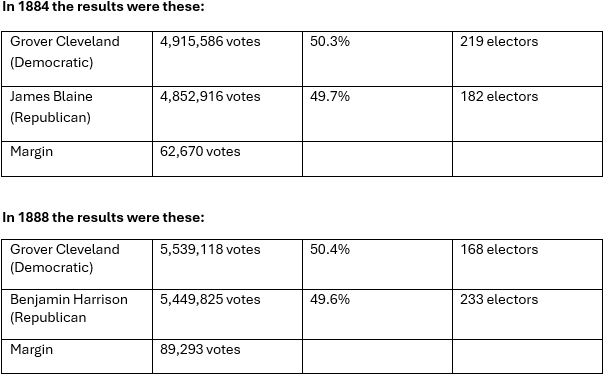
However, notwithstanding its lack of wisdom that article it did contain some information which I now repeat regarding the 24th and 26th President, Grover Cleveland who served two non-consecutive terms, 1885-89 and 1893-97.


Now for a trivial detail. There have been 45 men serving as US president – but Cleveland and Trump are counted as two men. That is why Trump will be the 47th President.
Let me now explain why I refer to these four presidential terms in the way I do. The 1885-89 term was the first Cleveland aberration while the 2017-21 term was the first Trump aberration. The 1893-97 term was the second Cleveland aberration while the 2025-29 term is the second Trump aberration.
The point is that the two parties have never been equal. One or other has been dominant over different periods. After a shortish period known as “the era of good feelings” the American polity settled into “the First Democratic Era”. During that period Democratic candidates won in 1800, 1804, 1808, 1812, 1816, 1820, 1824, 1828, 1832, 1836, 1844, 1852 and 1856. The party of the right was then known as the Whigs. Its candidates won only twice, in 1840 and 1848, elections clearly described by historians as aberrations.
Historians are nearly unanimous in the opinion that Abraham Lincoln was America’s greatest president. His Republican Party re-aligned the party system, so we had “the First Republican Era”. In that period Republican candidates won in 1860, 1864, 1868, 1872, 1876, 1880, 1888, 1896, 1900, 1904, 1908, 1920, 1924 and 1928. Democratic candidates won only in 1884, 1892, 1912 and 1916.
Historians are nearly unanimous in the opinion that Franklin Roosevelt was America’s greatest president in the first half of the 20th Century. His Democratic Party re-aligned the party system again, so we had “the Second Democratic Era”. In that period Democratic candidates won in 1932, 1936, 1940, 1944, 1948, 1960, 1964 and 1976. Republican candidates won only in 1952, 1956, 1968 and 1972.
Again, historians are nearly unanimous in the opinion that Ronald Reagan was America’s greatest president in the second half of the 20th Century. His Republican Party won massive victories in 1980, 1984 and 1988 in what is often referred to as “the Second Republican Era”.
I insist that the period from 1992 to the present day should be described as “the Third Democratic Era”. My basis for such an assertion has been to add up all the presidential votes from 1992 to 2024. The result is that 560 million votes have been cast for Democratic presidential candidates and 526 million for Republican candidates. Democratic candidates have enjoyed good wins in 1992, 1996, 2008, 2012 and 2020. Republican candidates have won the popular vote narrowly in 2004 and 2024. Republican wins of the presidency in 2000 and 2016 were due entirely to the vagaries of the electoral college system.
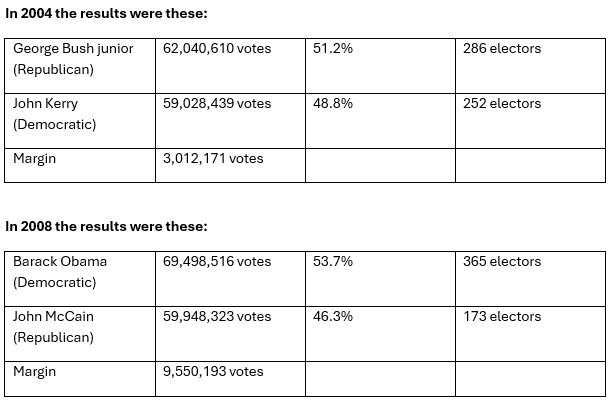
Very early in this article I gave the 2024 popular vote. I now give the 2004 popular vote – but I also give the same kinds of detail for the following election in 2008. I give 2008 because it constitutes a very good omen for the 2028 election.

There is a further detail in the above to which I invite attention. In 2004 Bush enjoyed a better popular vote win than did Trump in 2024, a margin of 3,012,171 votes compared with 2,286,335 votes for Trump. Whereas the Bush percentage of the two-candidate vote was 51.2 for Trump it was only 50.8 per cent. Indeed, Trump’s win in 2024 was the poorest since Richard Nixon’s first win in 1968.
On the basis of his pretences about the 2024 elections the convicted felon Trump will claim a mandate to make radical changes to American society. He has no mandate. In the House of Representatives, the 2024 result was only 220 Republicans to 215 Democrats meaning that when the 119th Congress first met on January 3 the Republican candidate for Speaker Mike Johnson collected only 218 votes to 215 for the Democratic candidate Hakeem Jeffries.
The Senate is better for the Republicans with their 53-47 majority. However, the US Senate is like its Australian counterpart in being unrepresentative swill. The House of Representatives has 435 members with each member representing some 700,000 people. It is truly democratic. The Senate is not. But the Republican Party will hold a Senate majority for the whole Trump term while losing its House of Representatives majority at the mid-term elections in November 2026.
It won’t take very long for the American people to realise how right they were to kick Trump out in 2020 and how foolish they were to restore him to the presidency in 2024. In the meantime, I have demonstrated the similarity between Grover Cleveland and Donald Trump. Each was a candidate for the minority party in an era of the opposite party being the majority party. That is why I describe their four terms as aberrations.

What’s my favourite election for this year?

“Electoral history is littered with unexpected landslides.” That was the favourite aphorism of my friend the late Sir David Butler (1924- 2022). He was the eminent psephologist of the United Kingdom and that was one of the many perceptive comments he used to make. It is very true, and I can attest that it is quite rare to have a very close election preceded by pundit predictions that it would be very close. I learnt as long ago as 1961 that very close elections typically come as a shock as was the case in December that year when Bob Menzies was universally expected to win handsomely his sixth straight election - only to be treated to the shock of a very close result, a genuine “cliffhanger”.

During 2024 I have publicly commented upon, and made predictions for, overseas elections in India, Ireland, South Africa, the United Kingdom and the United States. I have also done that for several Australian by-elections, for state elections in Tasmania and Queensland and for territory elections in the Northern Territory and the ACT. All those elections went as I predicted but that is not important. What is important is that two of them illustrated the Butler aphorism. The two cases are the Northern Territory general election on Saturday 24 August and the US presidential election on Tuesday 5 November. Both were preceded by the frequent saying of “it will be very close” and in both cases many historians have pronounced the result to have been a landslide. The two cases of my predictions can be found in Switzer Daily for July 19 “June 27 and July 13 gave Trump the 2024 election” and for August 2 “Is Labor set to lose power in the Northern Territory?”.In the former case I made this further prediction: “Mark my words. The second Trump aberration will be just as bad for America as the first.” In the latter case my further comment came with a question: “With a run of elections ahead, will a potential loss in the Northern Territory be the first pin to fall for Labor? Here are my predictions.”

In both these cases I correctly named the winner but did not do particularly well on the details – but at least I was willing to name a predicted winner and did not resort to the standard non-prediction of “it is too close to call”. My favourite election for 2024, therefore, must be one of these two, so my decision has been made of the basis of my joy or gloom at the result. The NT result gave me joy, so that becomes my favourite. My view of Trump is that he is a charlatan and a criminal. He seems to have one virtue: he is not a drinker. Apart from that I see him to be wholly without merit or virtue of any kind. I’ll leave my analysis of that election until January 2025 and content myself for the moment to say that I wish my prediction had been proved wrong.

For the Northern Territory, my prediction was that Lia Finocchiaro would be the new Chief Minister in a majority Country Liberal Party government with 14 seats. In the event the CLP won 17 seats so I was wrong to predict the CLP would not gain the then Labor seats of Casuarina, Drysdale and Sanderson. However, my understating of Labor’s disaster did not end there. I believed that I was predicting a bad result for Labor when I wrote that Labor would hold nine of the 15 seats it had pre-election. In the end Labor held only four, all remote seats with significant aboriginal populations, Arafura, Arnhem, Daly and Gwoja.

Labor’s other losses begin with Nightcliff to the Greens. Nightcliff was Labor’s strongest win in 2020 and during the count it appeared that it would remain with former (failed) Chief Minister Natasha Fyles. However, in a surprise development the CLP candidate, Helen Secretary, fell into third place and her preferences were expected to favour Labor as per her “how-to-vote” recommendation. They were so undisciplined in the end that the Greens candidate, Kat McNamara, finished with 2,252 votes compared with 2,216 for Fyles. That meant Labor did not retain a single seat in the populous Darwin-Palmerston region where the party had won eleven seats in 2020.

Adjoining Nightcliff to its south is Fannie Bay, a seat I predicted would be lost by Labor to the CLP. That happened, but not in the way I expected. The sitting Labor member, Brent Potter, came in third. After the distribution of the 187 preferences of Leonard May (Independent), the count was 1,918 votes for the CLP winner Ms Laurie Zio, 1,424 for the Greens candidate and 1,319 for Potter. As demonstrated below, Potter would have won if he had come in second on the earlier counts – but whereas the Greens preferences were discipled to favour Labor over the CLP the Labor preferences were very undisciplined, meaning that the CLP won the seat. So, the Greens thought they could snatch two seats from Labor. They succeeded in Nightcliff – but had the effect of giving Fannie Bay to the CLP.

The fifth unexpected Labor loss was the Darwin northern suburbs seat of Johnston. It went to an independent candidate, Justine Davis. As in Fannie Bay Labor lost the seat because its sitting member, Joel Bowden, came in third and Davis finished with 2,425 votes compared with 1,782 for the CLP candidate Gary Strachan. Therefore, Labor won the two-party preferred vote with the CLP in seven seats but had only four wins. The three unusual cases were Fannie Bay (Labor 2,442 votes, CLP 2,219), Johnston (Labor 2,224 votes, CLP 1,983) and Nightcliff (Labor 2,908 votes, CLP 1,560).

As is so often the case, the Labor disaster in seats was essentially due to its very low overall vote. Labor is back to 1997 in that regard. At that election Labor scored only 42.1% of the two-party preferred vote compared with 42.7% in 2024. At the intervening elections Labor’s shares were 48.1% in 2001, 59.1% in 2005, 50.5% in 2008, 44.2% in 2012, 57.3% in 2016 and 53.9% in 2020. The best way to understand this election, however, is simply to look at my pre-election and post-election pendulums which are attached at the end of this article.

In January next year, my first article for 2025 will be my analysis of the US presidential election. It will be posted before the second Trump aberration begins on January 20. My main question to ask myself will be whether his win can be described as a landslide. I have answered that for Australia’s Northern Territory. It was a landslide victory for Lia Finocchiaro and the CLP.

In the meanwhile, I wish readers a happy Christmas and a bright and prosperous New Year.